Financial Analysis Dashboard Example
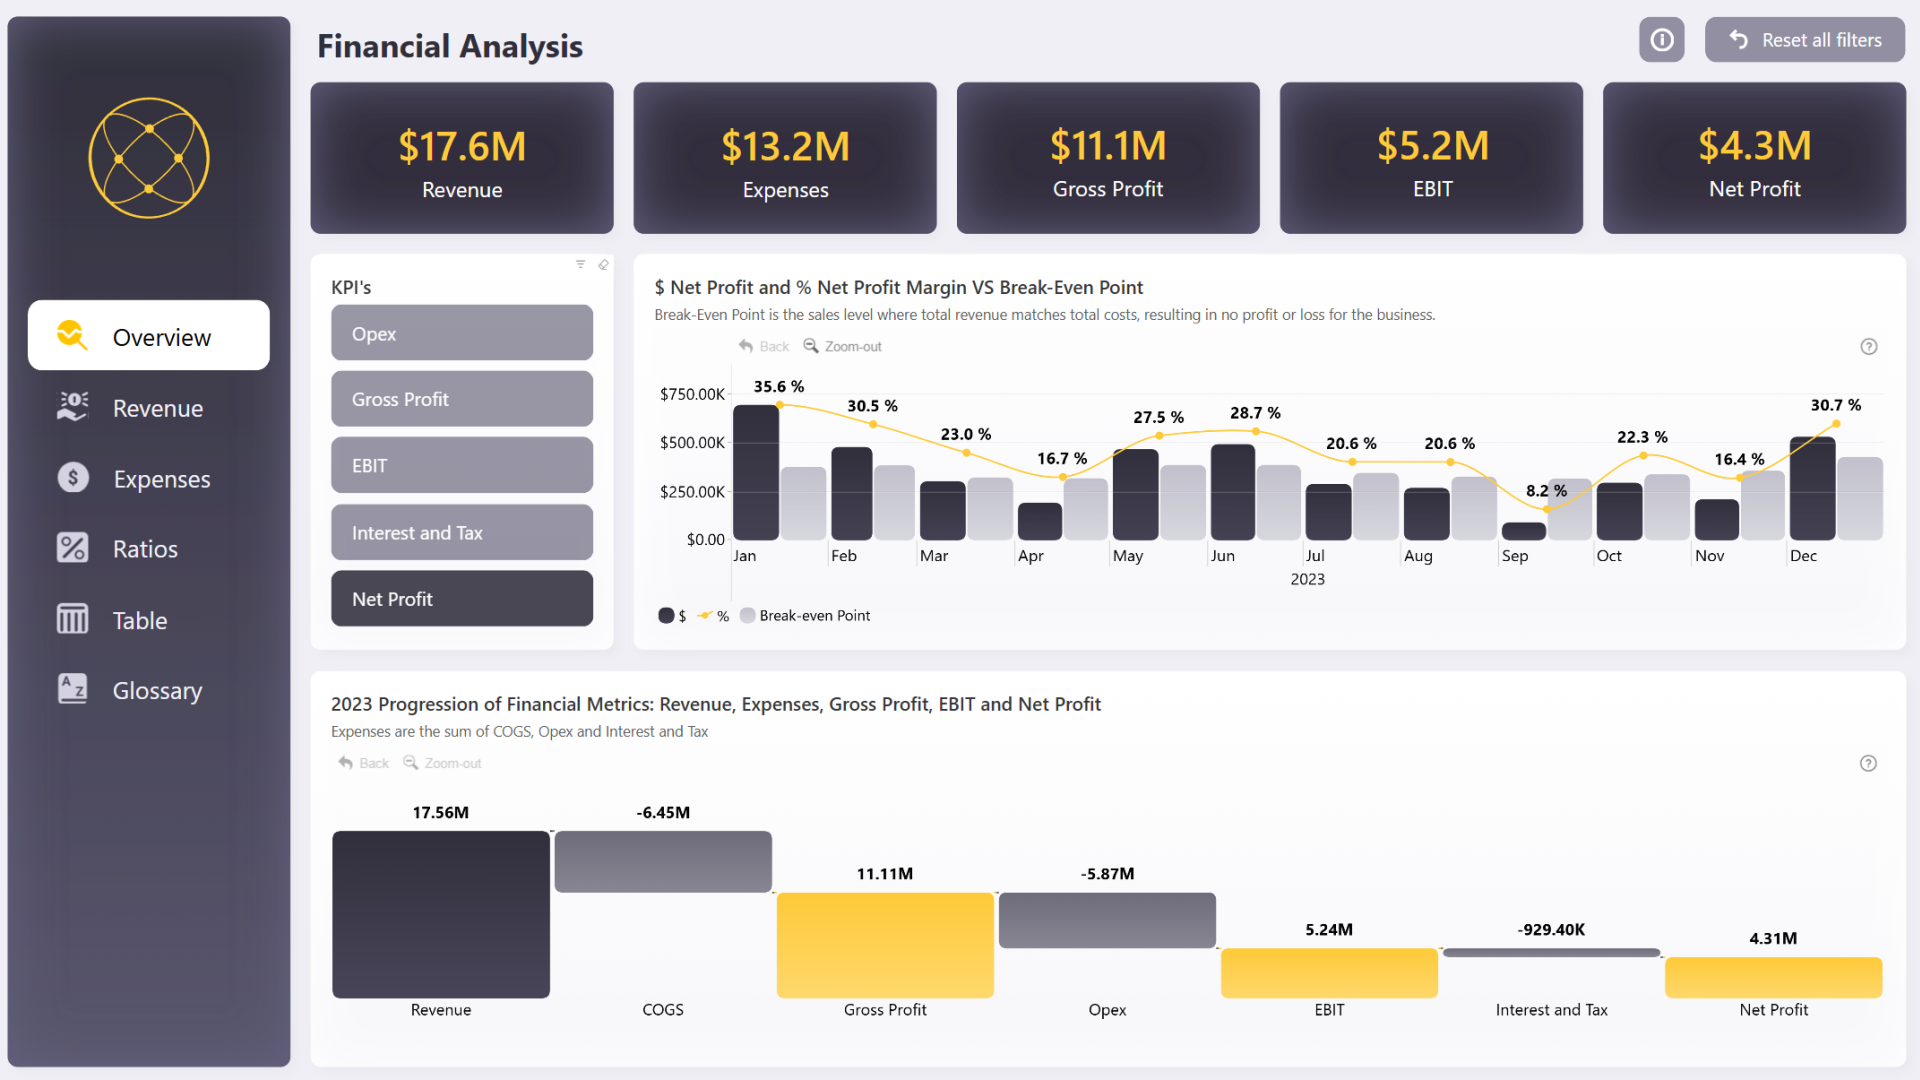
Analyze various financial insights across multiple pages - see how selecting data in one visual instantly applies a filter to the entire page, including KPI cards (not made by ZoomCharts). The time chart also showcases how you can combine multiple chart types - side-by-side columns for dollars and line for percentage.
While this dashboard is built on the Microsoft Power BI platform, it utilizes ZoomCharts JS technology for some or all its visual components.