Movie Industry Visualized: Dashboard Example
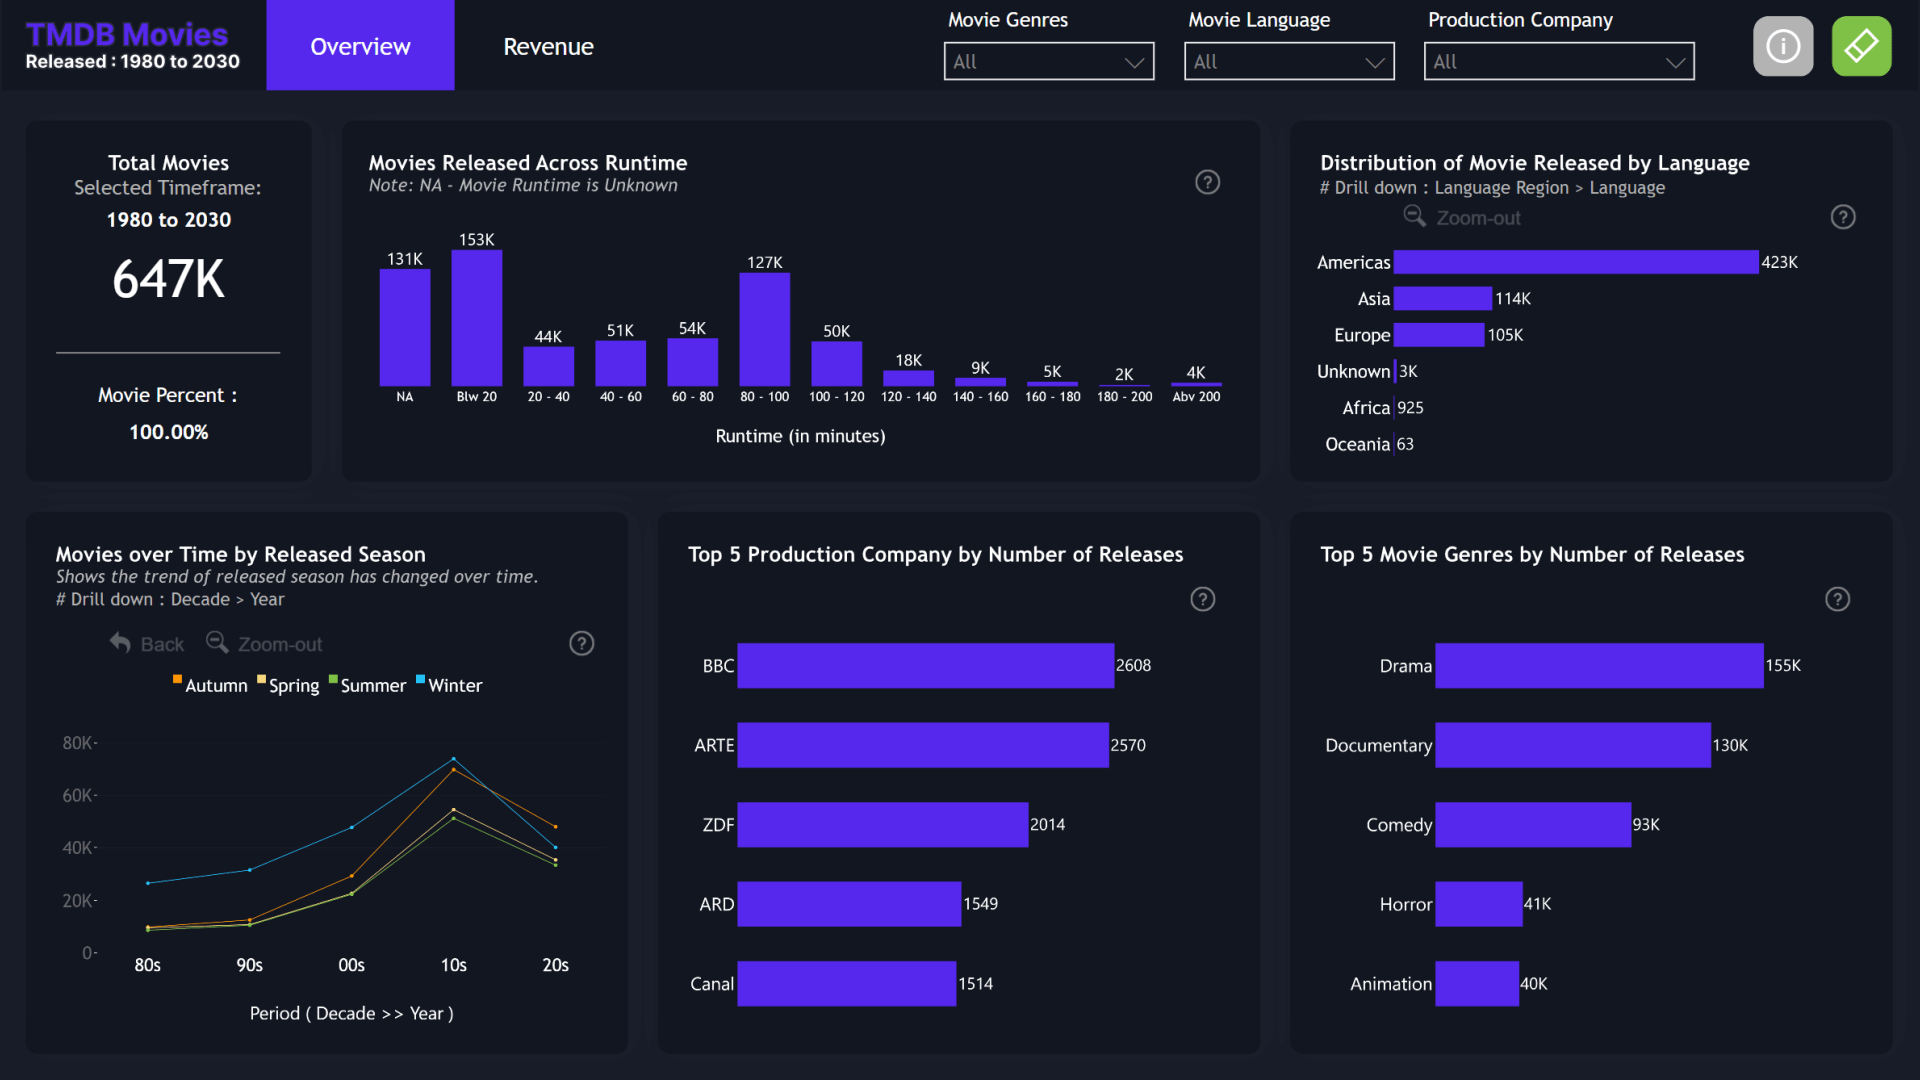
This dashboard uses data from TMDB to visualize various insights, like the most popular genres, runtimes, seasons, languages and others. It showcases how multiple ZoomCharts visuals can work together to dynamically filter data across the entire dashboard, and the customization options - note the dark theme which alters tooltips, toolbars, and other UI elements.
While this dashboard is built on the Microsoft Power BI platform, it utilizes ZoomCharts JS technology for some or all its visual components.