WEBINAR
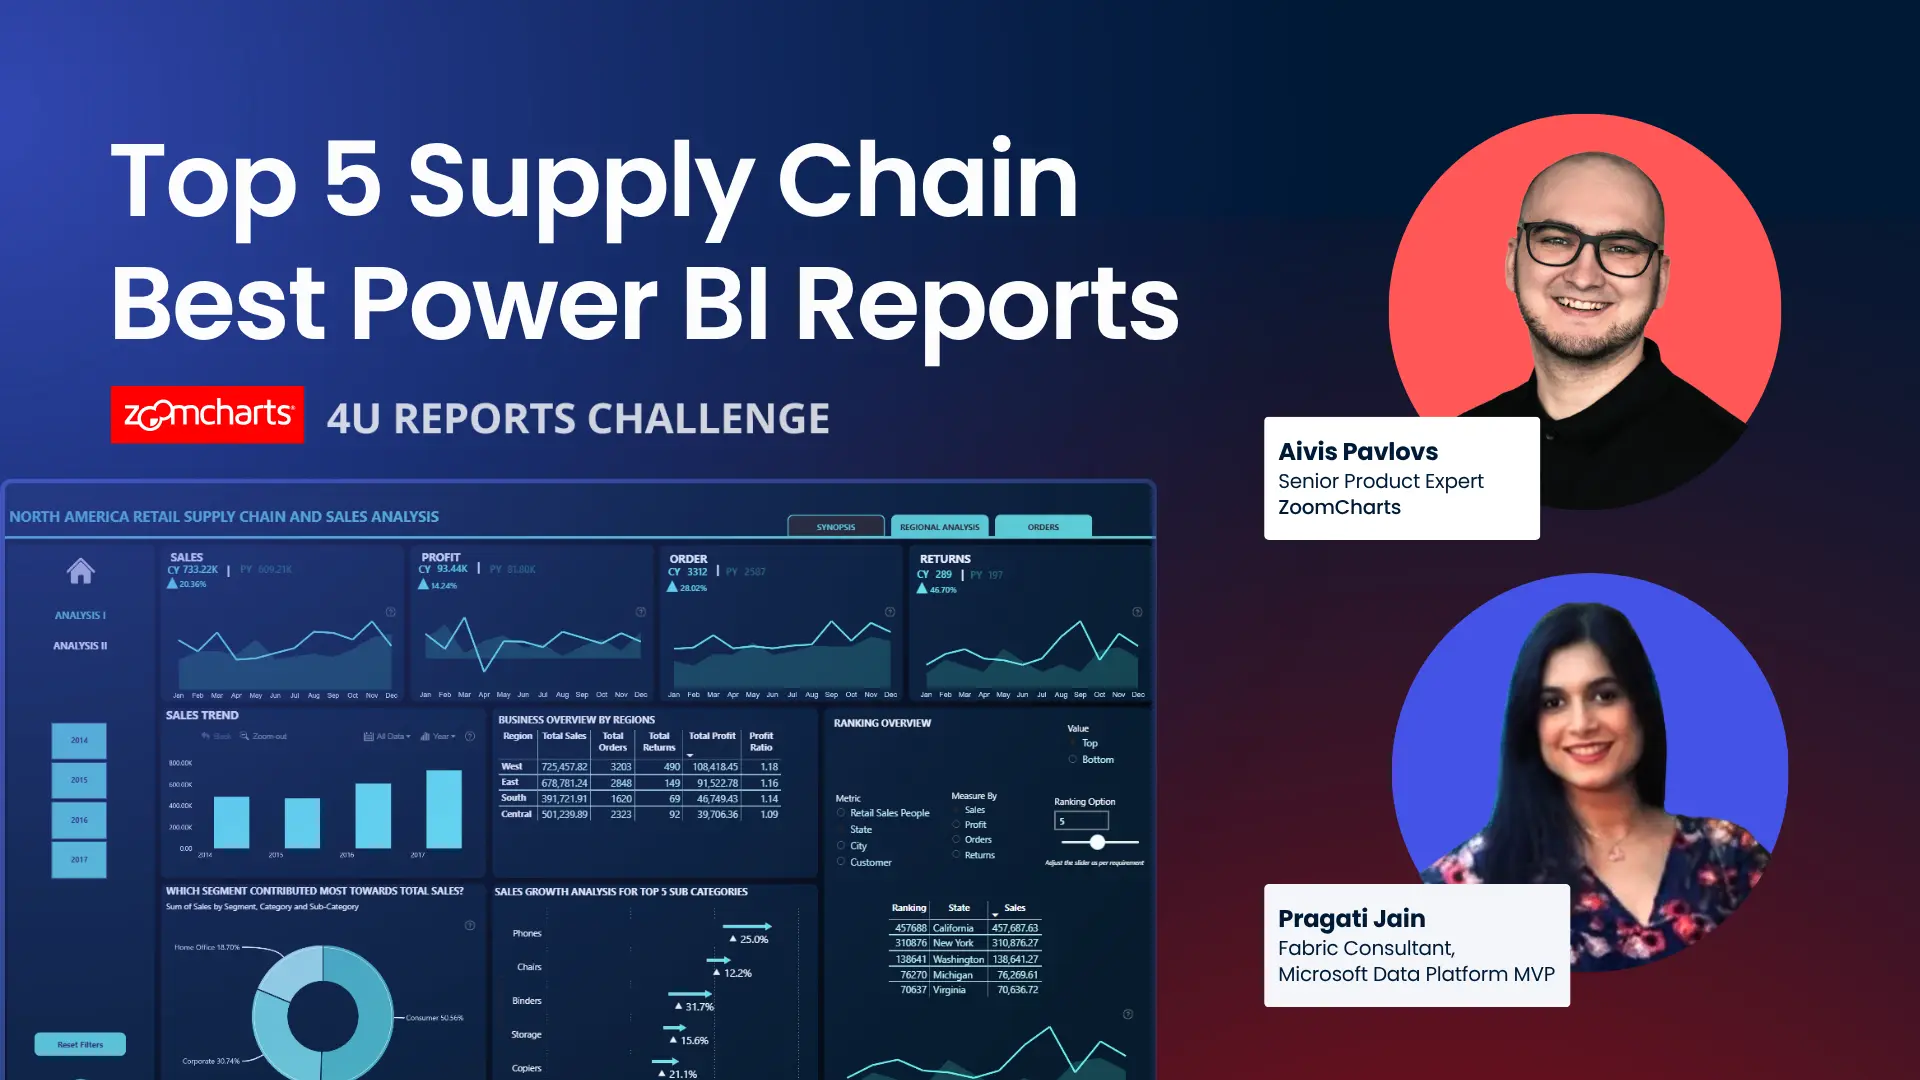
Top 5 Supply Chain Dashboards from 4U Report Challenge
Discover the best Power BI dashboards from the Supply Chain Analytics Challenge. Learn how top participants designed interactive dashboards to analyze delivery performance, stockouts, and operational efficiency.
WATCH RECORDING
About webinar
In this Power BI webinar, we will review the Top 5 reports from the ZoomCharts 4U Reports Challenge on Supply Chain Analytics.
The challenge used a food and beverage dataset covering orders, shipments, suppliers, warehouses, and customer channels. It includes delivery performance (OTIF), delays, stockouts, returns, and financial metrics such as revenue and gross profit.
During the session, we will look at how the top reports:
• Structure supply chain KPIs for quick understanding
• Show delivery performance and delays
• Highlight issues such as stockouts, returns, and waste
• Break down performance by supplier, warehouse, and channel
• Connect operational data with financial results
Speakers:
- Pragati Jain, Fabric Consultant and Microsoft Data Platform MVP
Our guest speaker and judge of the 4U Report Challenge May 2026. Will share feedback on the reports and explain what works from a data and decision-making perspective. - Aivis Pavlovs, ZoomCharts Power BI Expert
Will walk through the technical setup of visuals in dashboards.
Who this is for:
- Power BI users working with operational or supply chain data
- Anyone looking to improve report structure and usability
- Anyone interested in practical report design examples
This webinar focuses on real reports and clear examples you can apply in your own work.
Date and time
29 May, 2026
07:00 AM - EDT
Speakers

Aivis Pavlovs, Senior Product Expert at ZoomCharts

Pragati Jain, Fabric Consultant, Microsoft Data Platform MVP
Watch recording
About webinar
In this Power BI webinar, we will review the Top 5 reports from the ZoomCharts 4U Reports Challenge on Supply Chain Analytics.
The challenge used a food and beverage dataset covering orders, shipments, suppliers, warehouses, and customer channels. It includes delivery performance (OTIF), delays, stockouts, returns, and financial metrics such as revenue and gross profit.
During the session, we will look at how the top reports:
• Structure supply chain KPIs for quick understanding
• Show delivery performance and delays
• Highlight issues such as stockouts, returns, and waste
• Break down performance by supplier, warehouse, and channel
• Connect operational data with financial results
Speakers:
- Pragati Jain, Fabric Consultant and Microsoft Data Platform MVP
Our guest speaker and judge of the 4U Report Challenge May 2026. Will share feedback on the reports and explain what works from a data and decision-making perspective. - Aivis Pavlovs, ZoomCharts Power BI Expert
Will walk through the technical setup of visuals in dashboards.
Who this is for:
- Power BI users working with operational or supply chain data
- Anyone looking to improve report structure and usability
- Anyone interested in practical report design examples
This webinar focuses on real reports and clear examples you can apply in your own work.
Date and time
29 May, 2026
07:00 AM - EDT
Speakers
Aivis Pavlovs, Senior Product Expert at ZoomCharts
Pragati Jain, Fabric Consultant, Microsoft Data Platform MVP