WEBINAR
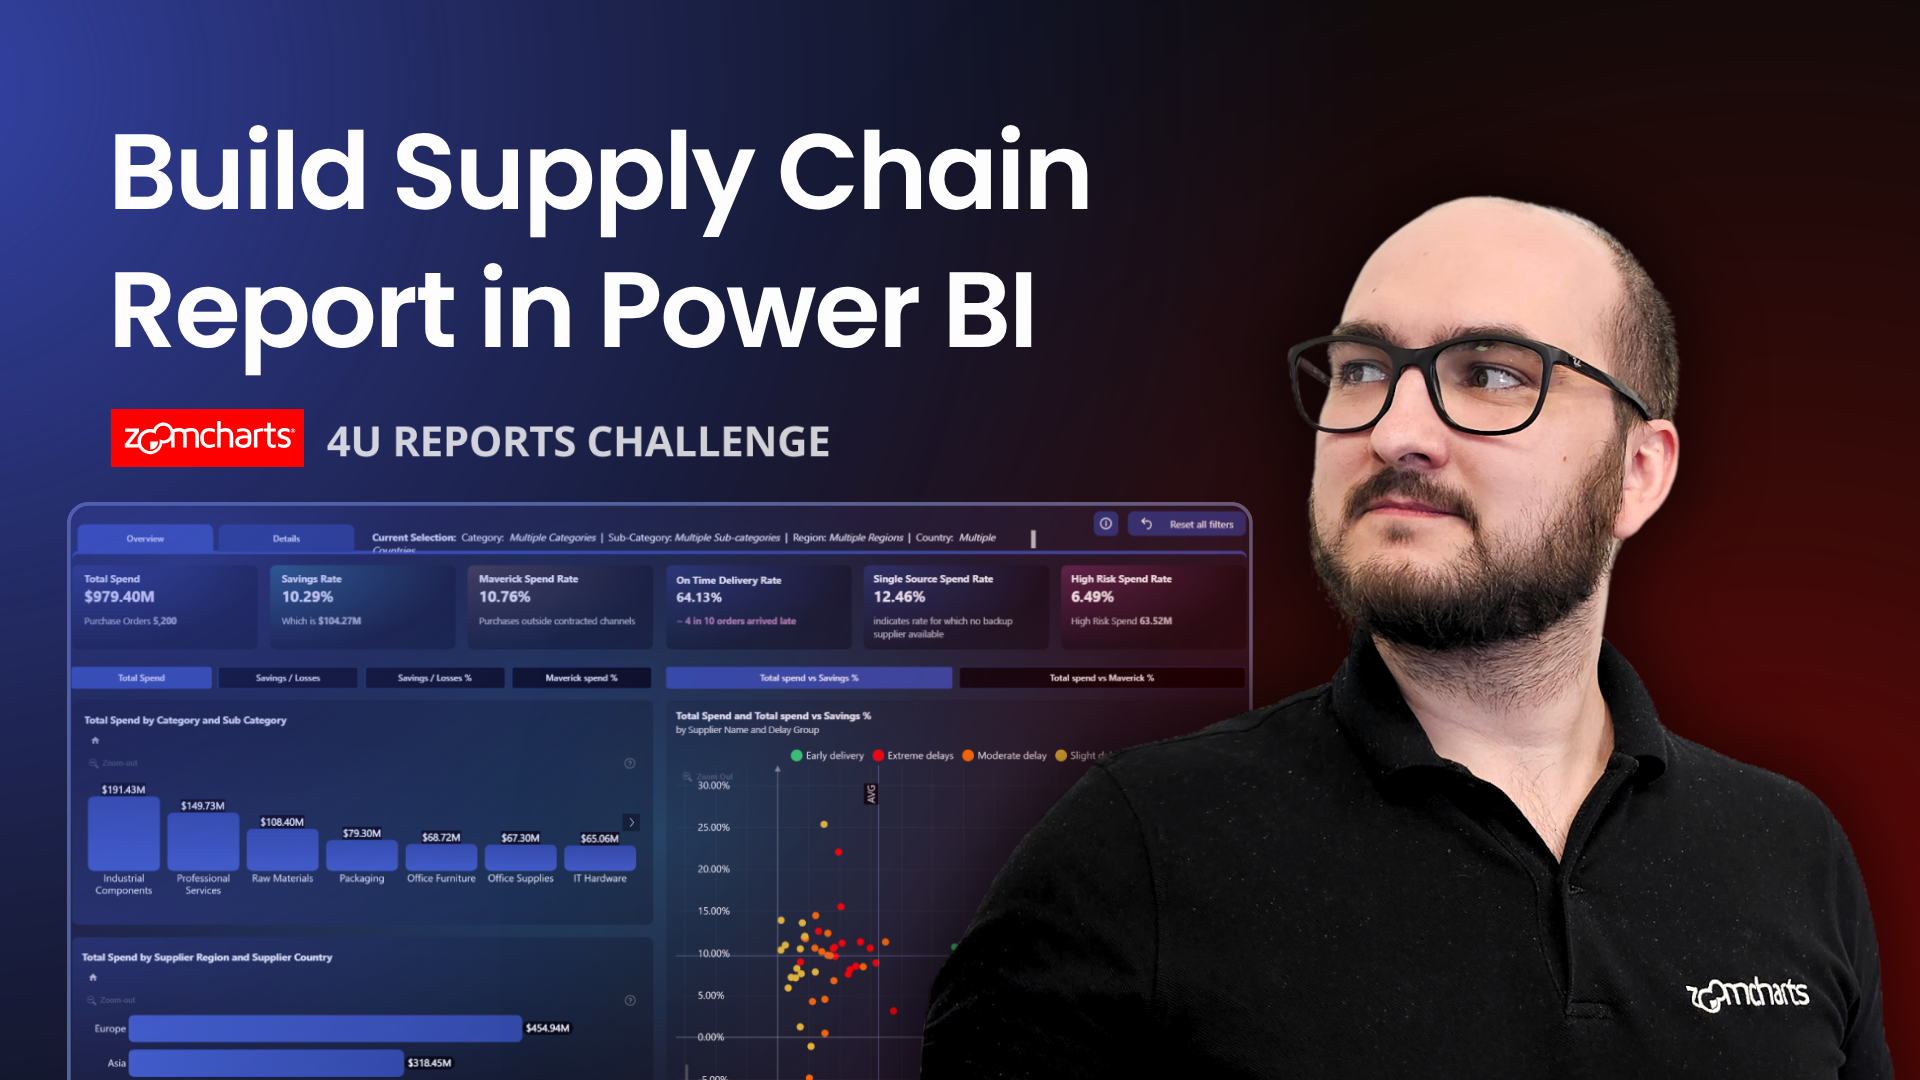
Build a High-Impact Supply Chain Dashboard in Power BI
Join this hands-on Power BI workshop to build a supply chain analytics dashboard using real-world data. Learn how to track delivery performance, analyze stockouts, and create interactive dashboards.
WATCH RECORDING
About webinar
In this hands-on Power BI webinar, you’ll learn how to design a supply chain analytics dashboard using a real-world food and beverage dataset, as part of the 4U Report Challenge.
The dataset covers end-to-end operations, including orders, shipments, suppliers, warehouses, and customer channels, along with key performance indicators such as OTIF (On-Time In-Full), delays, stockouts, returns, and waste.
During the session, we will guide you through building a report that helps decision-makers:
• Monitor delivery reliability and late shipments
• Identify stockouts and operational inefficiencies
• Analyze supplier and warehouse performance
• Understand how operational issues impact revenue and profitability
You will also see how to use ZoomCharts custom visuals like Drill Down PRO to create intuitive navigation and deep hierarchical analysis across supply chain dimensions.
By the end of the workshop, you’ll have a strong foundation for building interactive Power BI dashboards that combine operational insights with financial impact.
This session is ideal for anyone looking to improve their data visualization, dashboard design, and real-world Power BI skills.
Date and time
07 May, 2026
07:00 AM - EDT
Speakers

Aivis Pavlovs, Senior Product Expert at ZoomCharts
Watch recording
About webinar
In this hands-on Power BI webinar, you’ll learn how to design a supply chain analytics dashboard using a real-world food and beverage dataset, as part of the 4U Report Challenge.
The dataset covers end-to-end operations, including orders, shipments, suppliers, warehouses, and customer channels, along with key performance indicators such as OTIF (On-Time In-Full), delays, stockouts, returns, and waste.
During the session, we will guide you through building a report that helps decision-makers:
• Monitor delivery reliability and late shipments
• Identify stockouts and operational inefficiencies
• Analyze supplier and warehouse performance
• Understand how operational issues impact revenue and profitability
You will also see how to use ZoomCharts custom visuals like Drill Down PRO to create intuitive navigation and deep hierarchical analysis across supply chain dimensions.
By the end of the workshop, you’ll have a strong foundation for building interactive Power BI dashboards that combine operational insights with financial impact.
This session is ideal for anyone looking to improve their data visualization, dashboard design, and real-world Power BI skills.
Date and time
07 May, 2026
07:00 AM - EDT
Speakers
Aivis Pavlovs, Senior Product Expert at ZoomCharts