Quickstart
Drill Down Graph PRO brings advanced graphs to Power BI. With this visual, you can have full control over node relationships, fully customize each node or link, and build even the most complex hierarchies without compromising ease-of-use or readability.
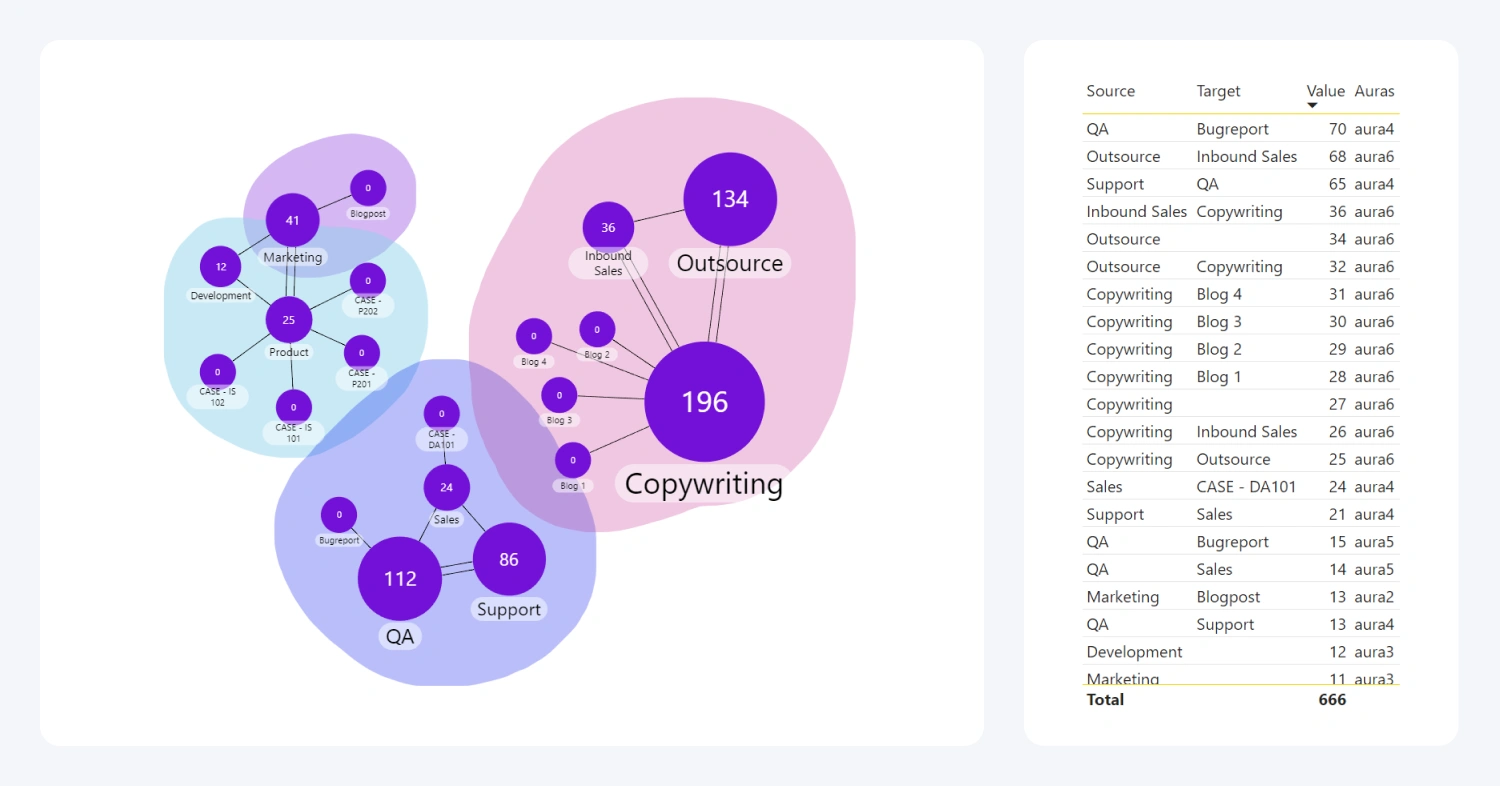
Before you begin
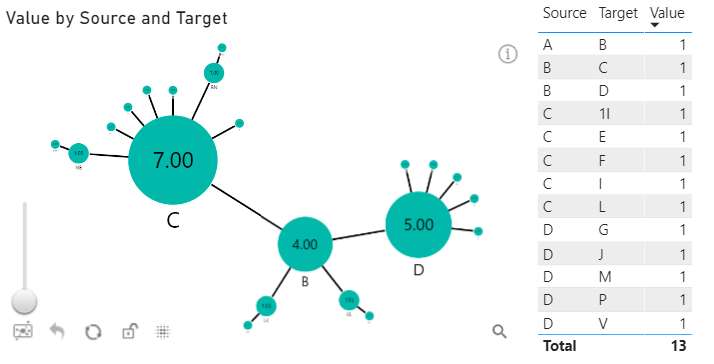
This visual uses a data structure based on Graph database. To successfully create a graph with this visual, you need three mandatory fields – source, target, and value. These fields are used to create nodes and identify inter-node relationships.
Graph database structure provides the report creators with more control and new ways to visualize data, including bidirectional link support, DAX-calculated measure support, and customization for each individual node and link.
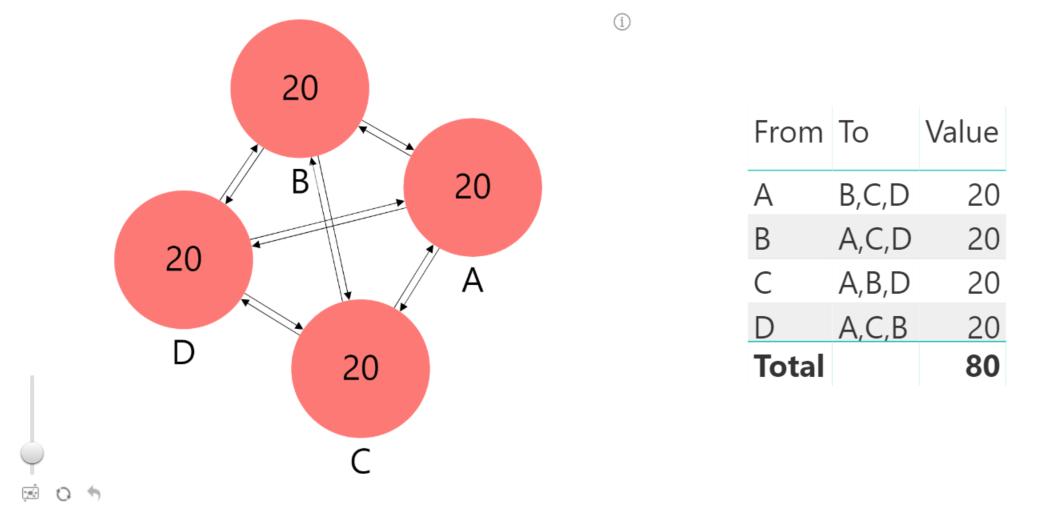
In addition to the mandatory fields, various optional fields are available to customize certain aspects of links and nodes, such as tooltip info, custom node images or colors, aura affiliation, focus nodes, and more. You can read more in the Setting Up Fields page.
Adding Drill Down Graph PRO to Power BI
If you have downloaded this visual from Microsoft AppSource within Power BI Desktop, its icon should automatically appear in the Visualizations pane on the right side of your Power BI window.
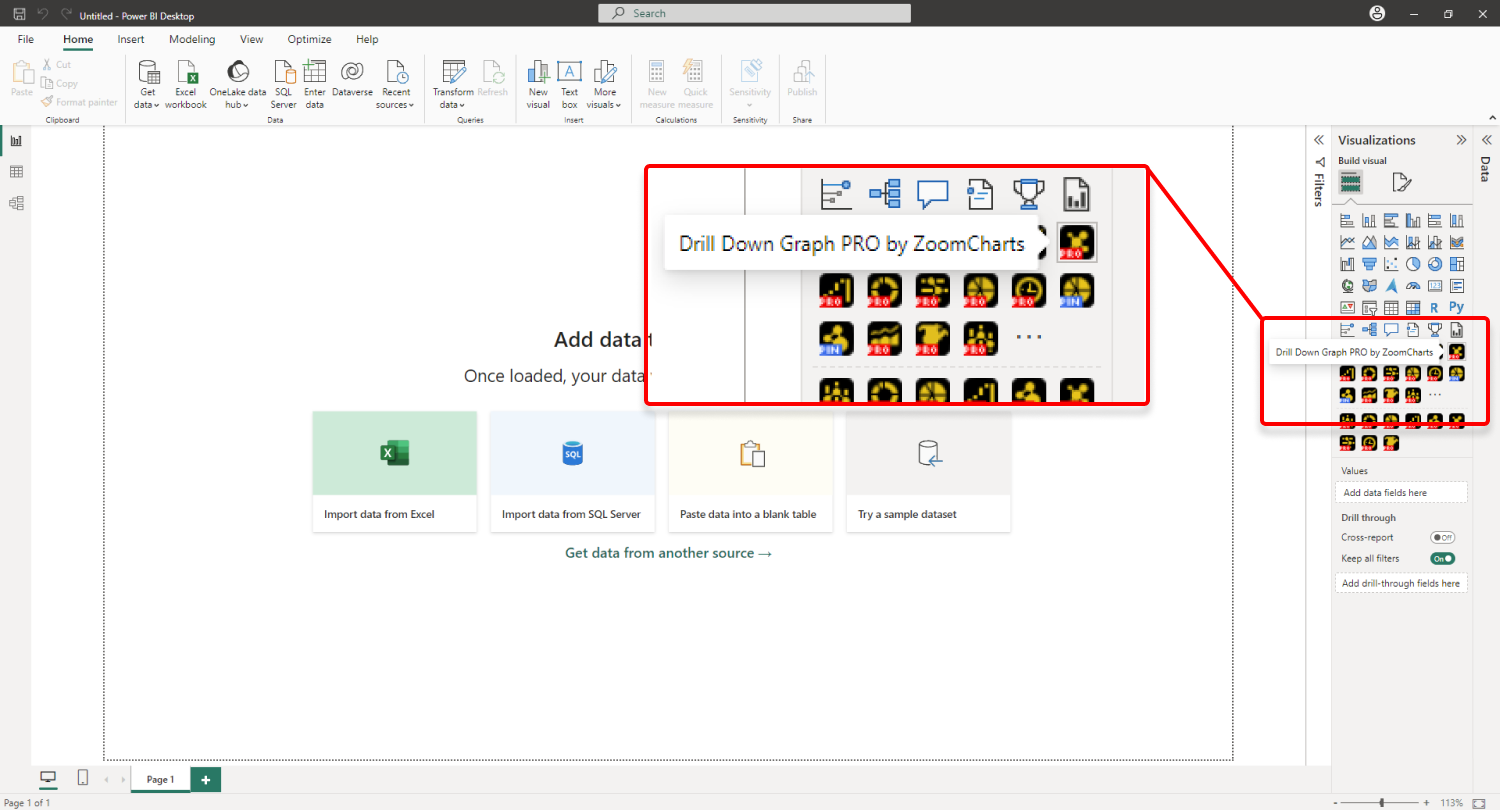
If you have acquired Drill Down Graph PRO externally, you may need to add it to Power BI manually. You can do that by clicking the ellipsis button at the end of the visualizations list, and pressing Import a visual from a file. Locate the .pbiviz file and the visual will be added to the Visualizations pane.
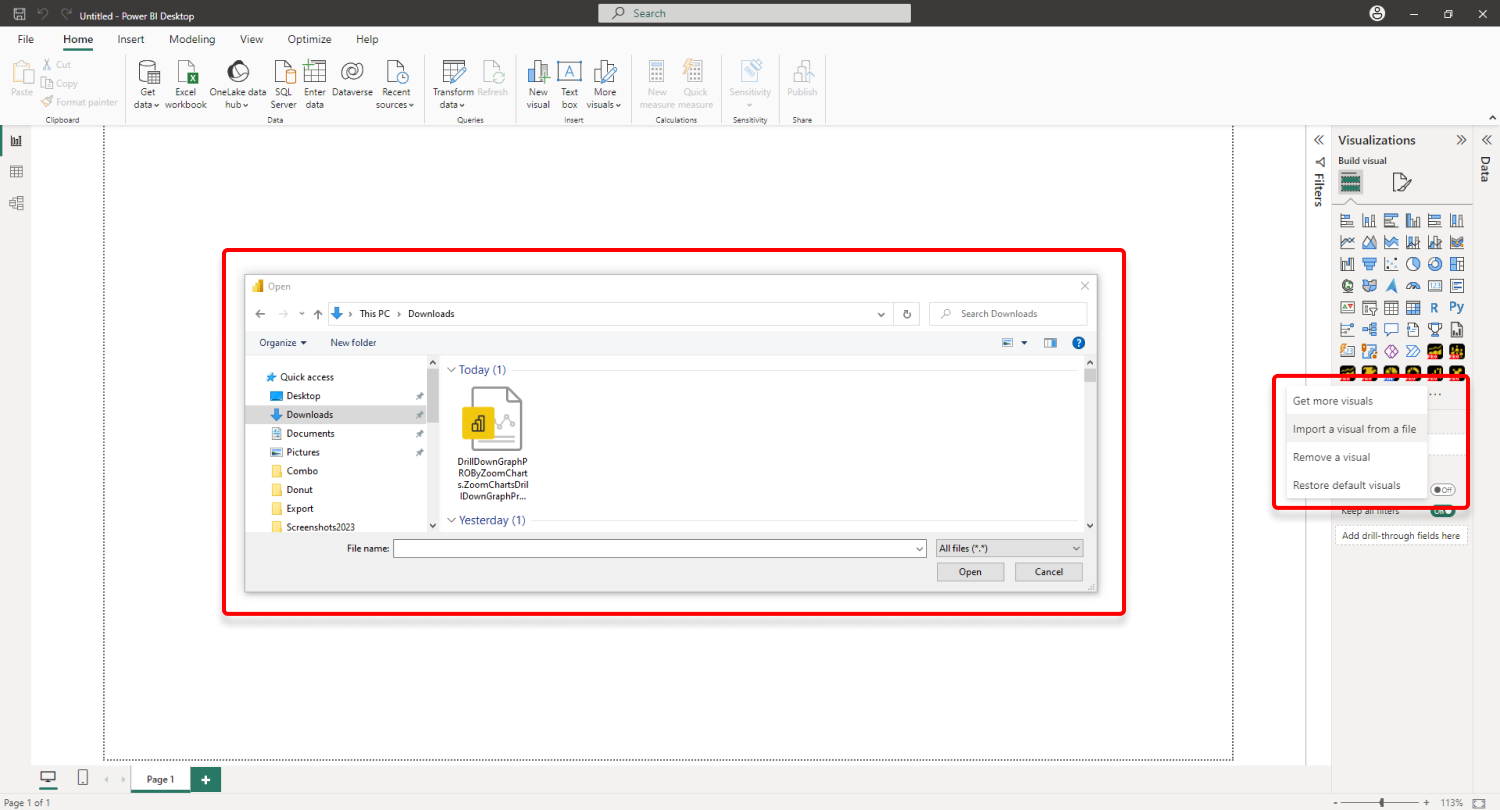
Creating a graph with Drill Down Graph PRO
Add Drill Down Graph PRO to your Power BI report by clicking the visual’s icon in the Visualizations pane. Doing so will create a blank visual that contains no data. Once you add the required fields - Source, Target, and Value ¬- your data will be visualized if the data is set up correctly.
- Source Node properties
- Target Node properties
- Link properties
- Node and Link Tooltips
Was this helpful? Thank you for your feedback!
Sorry about that.
How can we improve it?