1167
Financial Complaints Data Analysis Report
Financial Complaints Data Analysis Report
More Report pages
Report Author: Obinna Nweke
1167
Share template with others
This Financial Complaints Data Analysis Report helps users analyze consumer complaint data across financial products, issue categories, and company responses.
This Power BI report uses the Consumer Financial Complaints Dataset and features ZoomCharts Drill Down PRO custom visuals for Power BI. It was submitted to the Onyx Data DataDNA ZoomCharts Mini Challenge in October 2025.
Author Description:
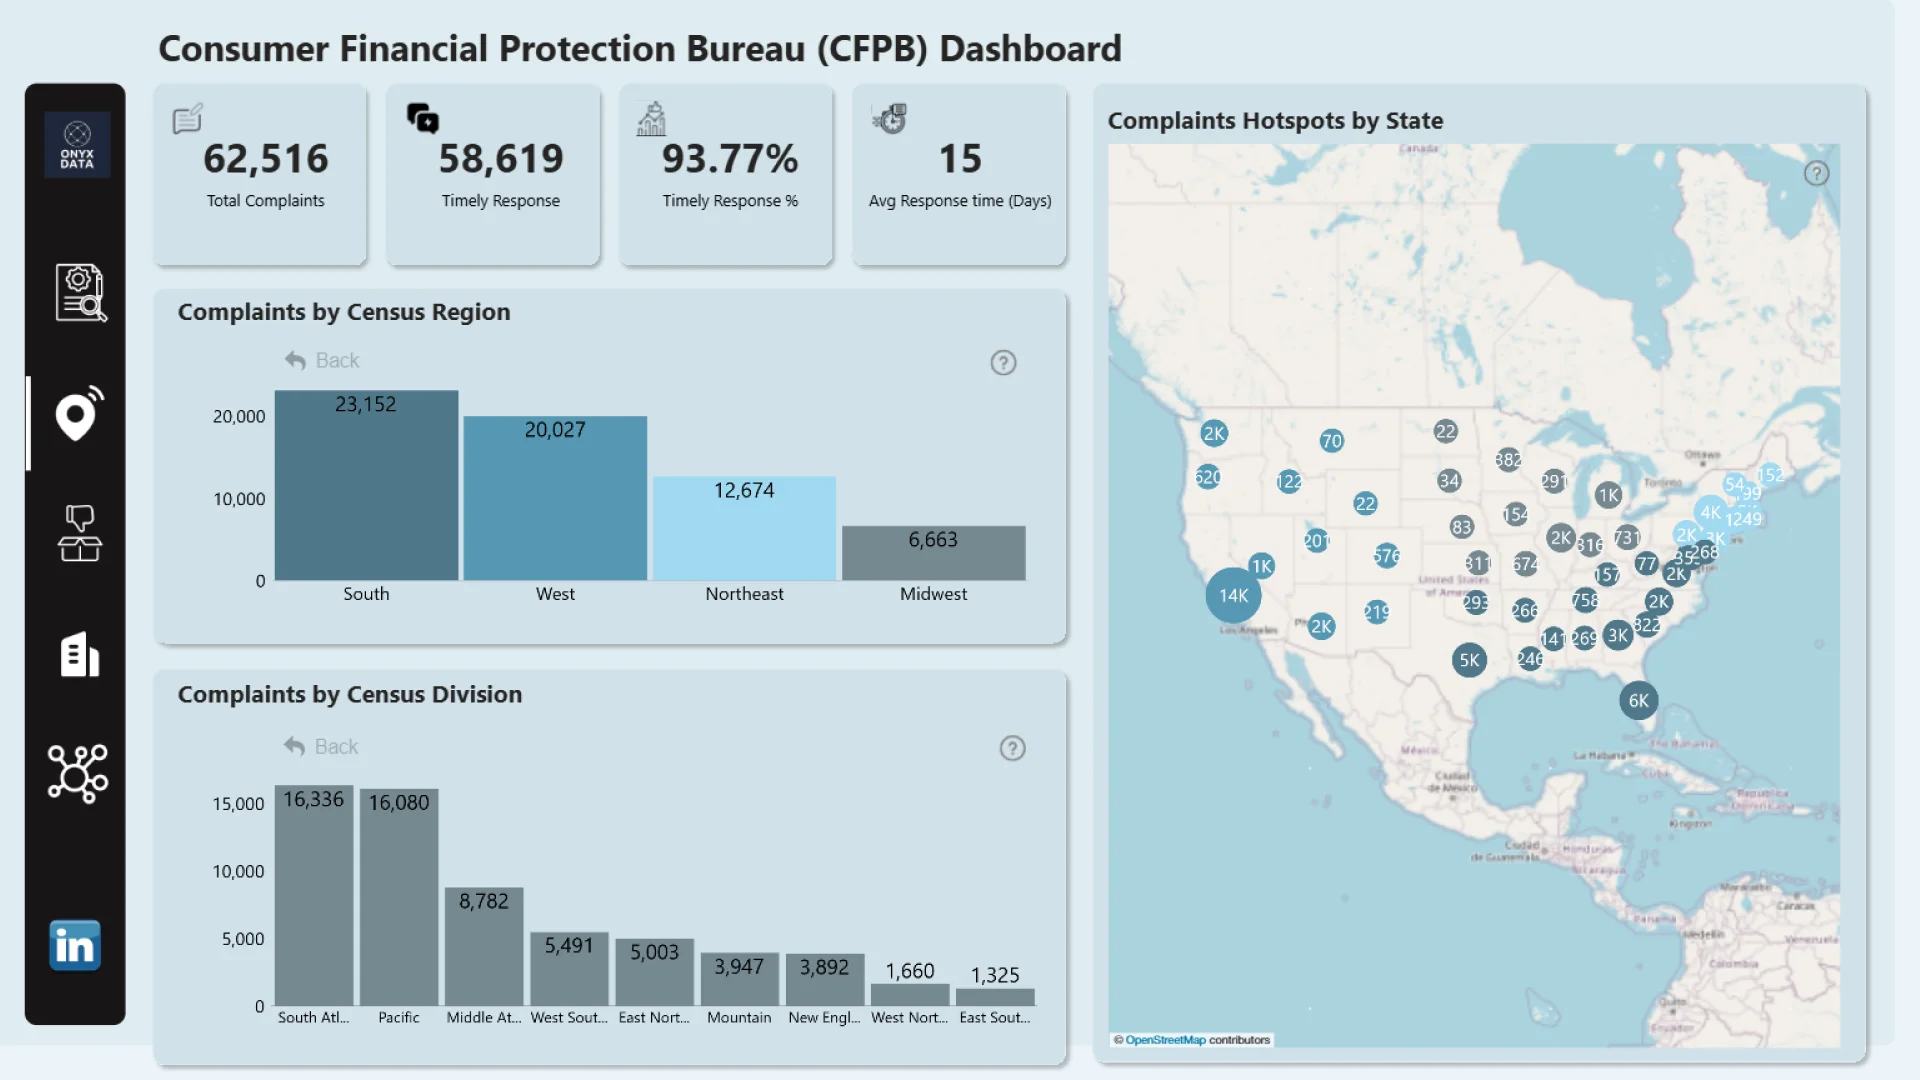
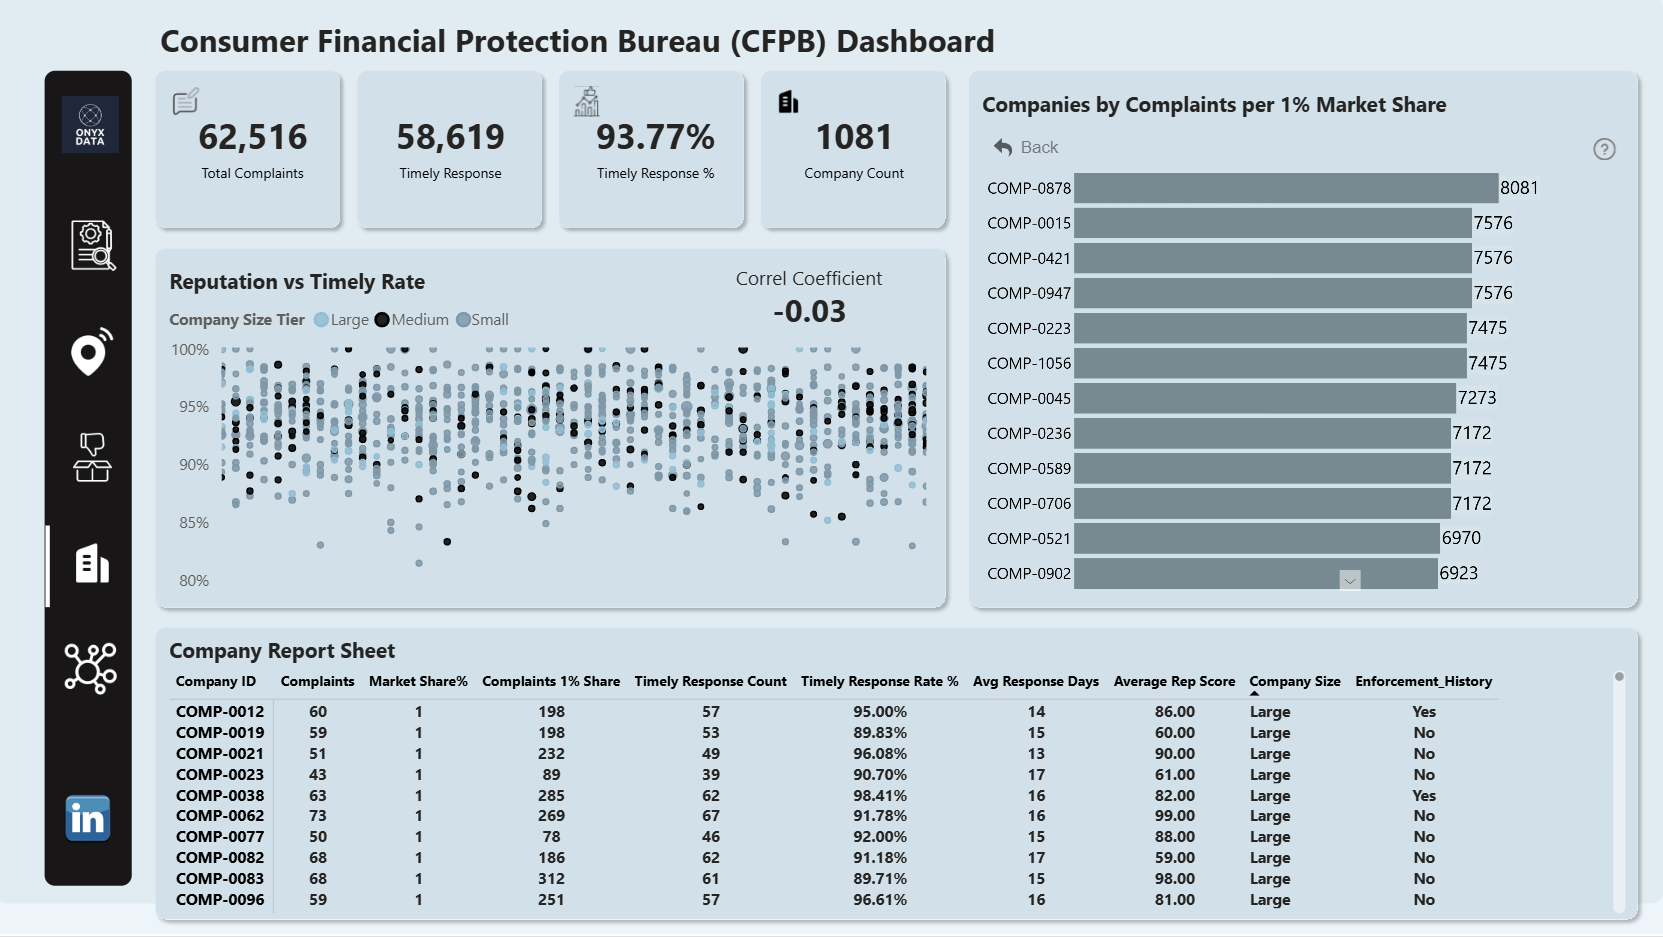
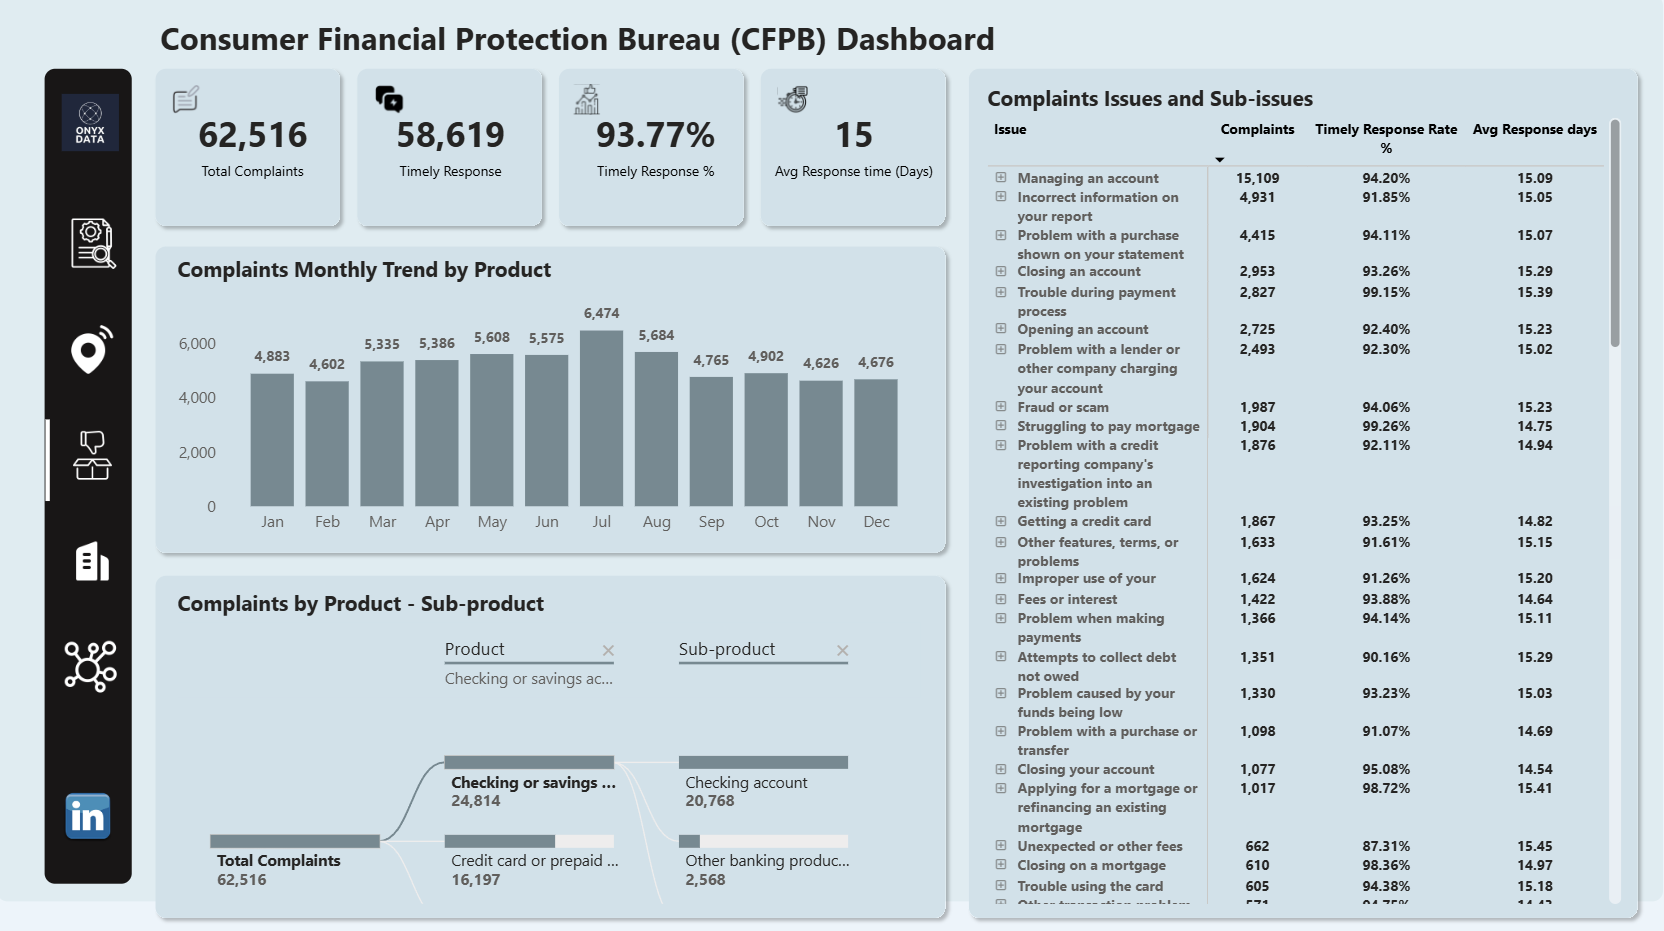
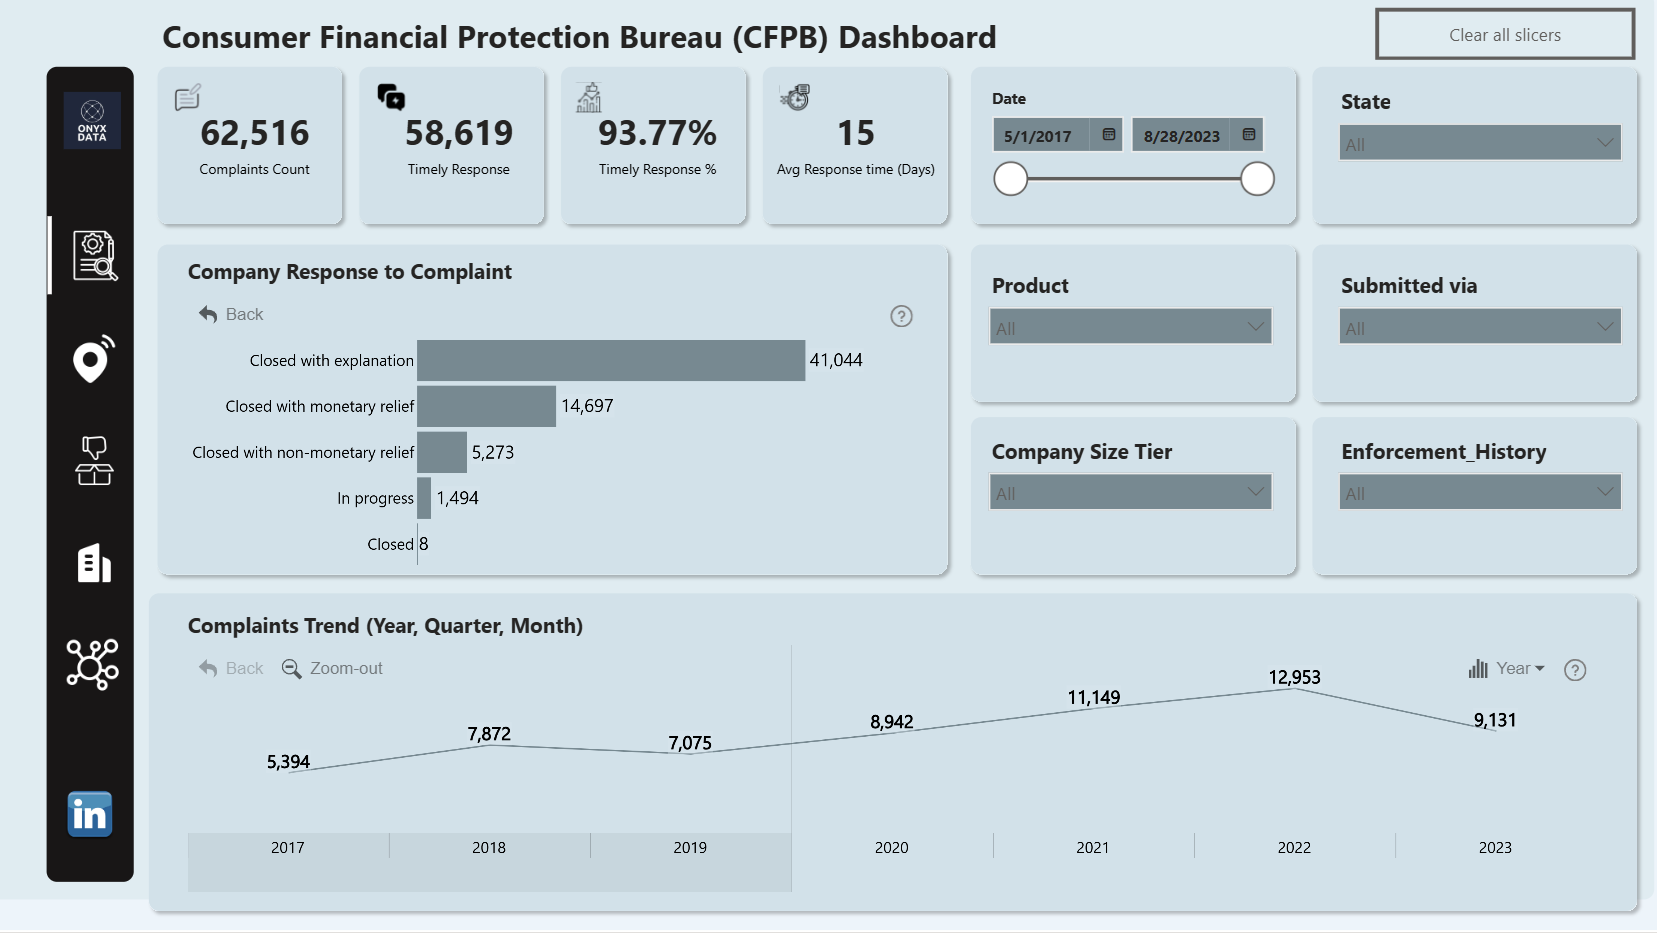
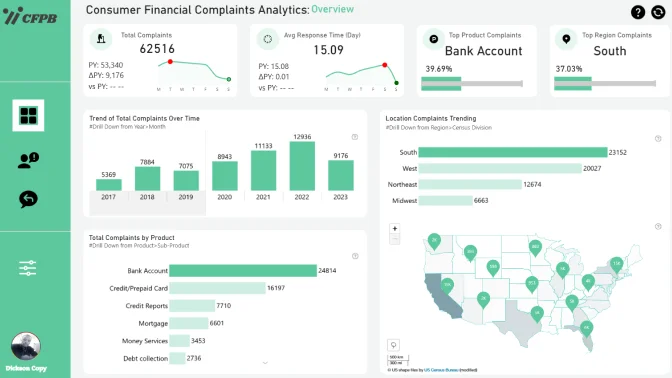
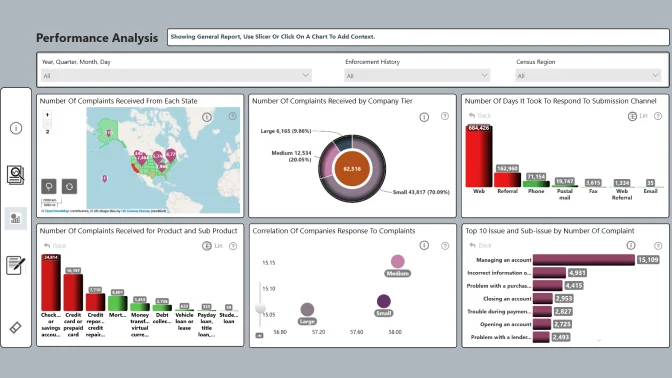
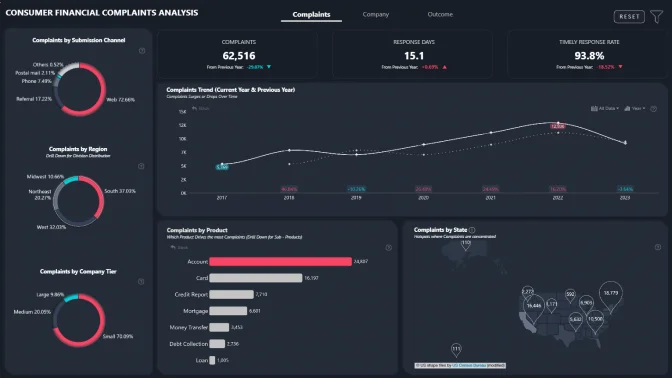
Between 2017 and 2023, the CFPB received 62,507 consumer complaints, peaking in 2022 before a slight decline in 2023. Most complaints came from the Southern and Western regions, led by California, Florida, Texas, and Georgia, with checking/savings accounts and credit cards driving the majority of issues. Companies maintained a strong 93.8% timely response rate, though smaller institutions faced greater challenges. Digital channels enabled faster resolutions, while email remained slower. Strengthening compliance in small firms, improving credit reporting accuracy, and expanding digital complaint systems can enhance consumer trust and regulatory effectiveness.
ZoomCharts visuals used




4U Report Challenges
Participate in data challenges, build and submit reports to get free template downloads.
Join CommunityMobile view allows you to interact with the report. To Download the template please switch to desktop view.
How to use a PBIX template
Preview the interactive report, download the PBIX file, open it in Power BI Desktop, and replace the same data connection with your own dataset.
Preview and download
Explore the report online and download the PBIX template file.
Open in Power BI Desktop
Open the downloaded PBIX file in Power BI Desktop.
Connect your data
Replace the sample data source with your own dataset.
Refresh and adjust
Refresh the model and update fields or visual were needed.
Save and share
Save your report and publish it for your audience.


