logo
For Power BI
  • Products
    • Custom Visuals for Power BI
    • Report Templates
  • Resources

      Resources

    • Documentation
    • Report Examples
    • Blog
    • Webinars
    • Video Tutorials
    • Visuals Gallery

    Support

    • ZoomCharts Assistance
    • Contact Sales
    • Contact Support
    • FAQ

    Challenges

    Challenges

    Improve your report creation skills by participating in free challenges for report creators.

    Learn more
    Get Developer License
  • Services
    • Power BI Report Development
    • Custom Visual Development
  • Challenges
  • Pricing
    • Custom Visuals for Power BI
    • Report Templates
Subscribe
Subscribe
Get it now
Go back

Contents

Contest logo
Contest logo
Contest logo
Contest logo
Try Free Now
Go back

Onyx Data August 2024 Challenge

Report Author: Balu Chelluri

26

Velocity Edge -Financial Analysis

Report
Report Interact

Combo Bar Donut Manufacturing Accounting & Finance

Share template with others

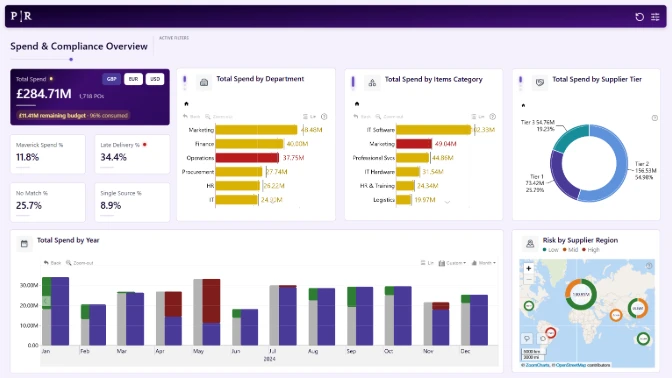
Report submitted for Onyx Data DataDNA ZoomCharts Mini Challenge, August 2024. The report was built based on Fitness Company Finance Dataset and includes ZoomCharts custom Drill Down PRO visuals for Power BI. 

Author's description:

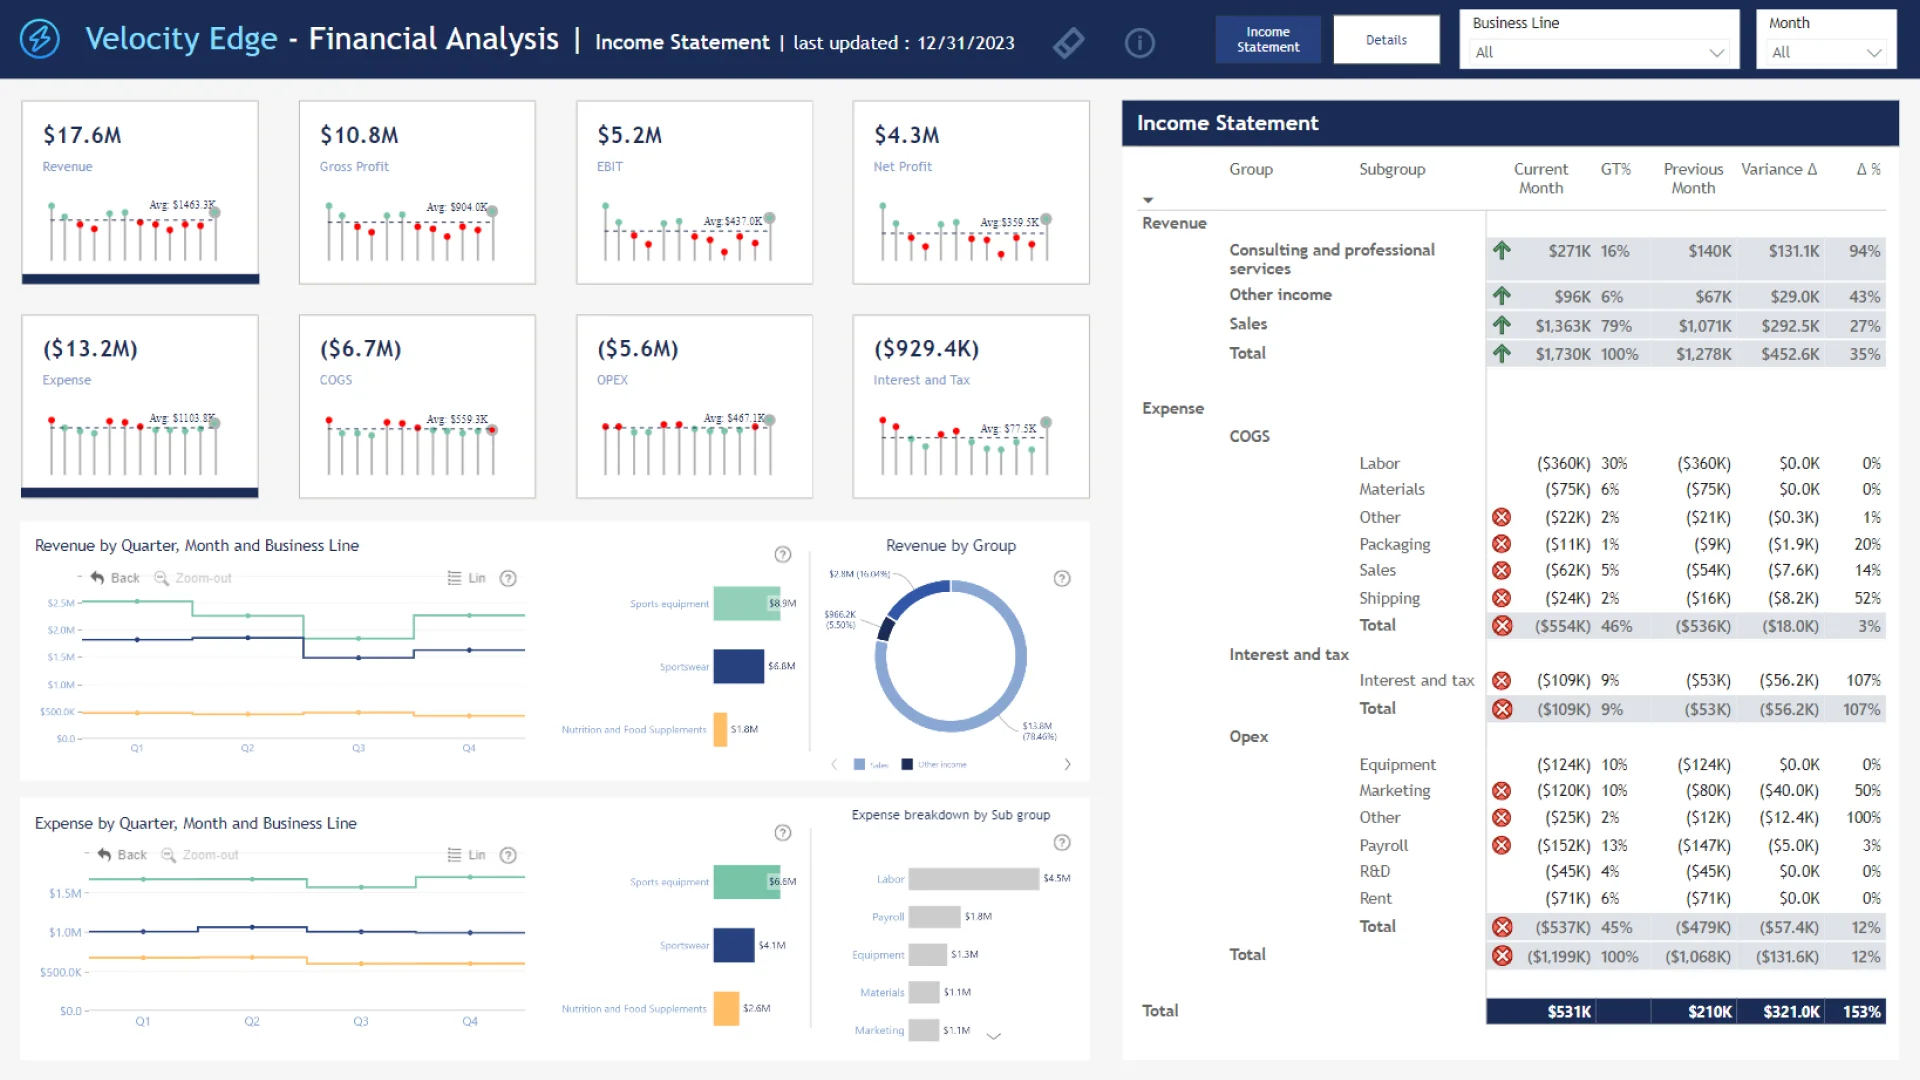
This analysis explores the financial performance of various business lines within Velocity Edge, a fictional U.S.-based sports company. The data covers a single year, limiting long-term trend observation. The company operates nationwide, following the U.S. sports calendar. While comprehensive, the analysis would benefit from additional product details to provide deeper insights.

Limitations:

  • The data spans only one year, restricting the analysis of long-term trends.
  • The analysis assumes nationwide operations, aligned with the U.S. sports calendar.
  • Additional product information could have enhanced the depth of the analysis.

Financial Terms:

  • Revenue: Total sum of all revenue sources.
  • COGS (Cost of Goods Sold): Total sum of all costs associated with goods sold.
  • Gross Profit: Revenue minus COGS.
  • OPEX (Operating Expenses): Total sum of all operating expenses.
  • EBIT (Earnings Before Interest and Tax): Gross Profit minus OPEX.
  • Interest and Tax: Costs related to interest payments and taxes.
  • Net Profit: EBIT minus Interest and Tax.
  • Expense: Total sum of all expense categories.

Margins are calculated as a percentage of revenue.

Insights:

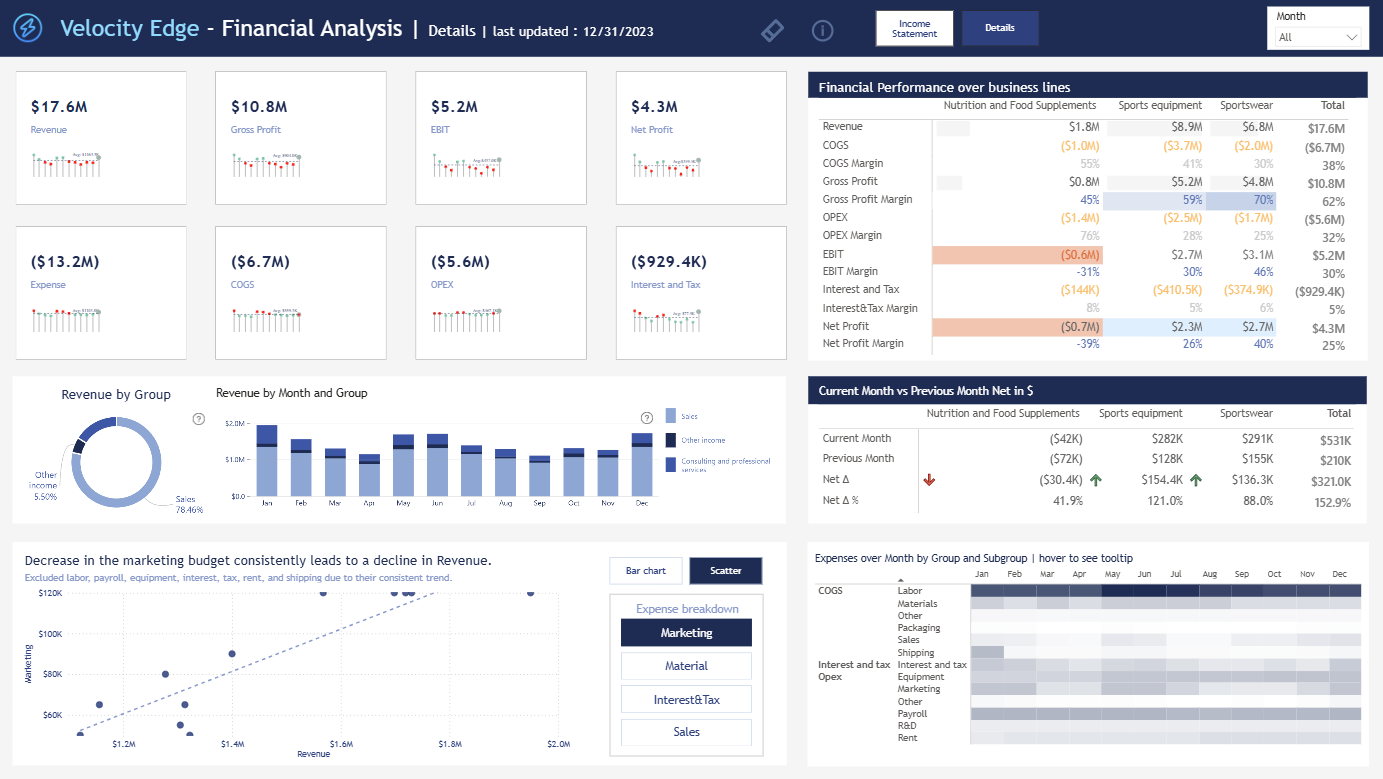
  • While sports equipment generates higher revenue than sportswear, it has a much lower net profit due to high COGS. Sales expenses for sports equipment are nearly 3.5 times higher than those for sportswear, significantly reducing profitability.

Recommendations:

  • Increase Marketing Spend: Focus on December, May, and June, aligning promotions with key sports events and seasonal trends. Adjust marketing budgets based on past performance, regularly reviewing strategies for effectiveness.

Key Trends:

  • Sports Equipment:

    • MLB Season (October): Expect a sales spike during the playoffs and World Series, driving demand for baseball gear.
    • NFL Draft (May): Anticipate increased sales fueled by interest in football gear.
  • Sportswear:

    • NBA Finals (May and June): Sales of sportswear, particularly basketball apparel, peak during the NBA Finals.
  • All Sports Gear:

    • MLS Season (December): December typically sees increased sales across all sports gear categories due to the MLS Cup and holiday shopping.

Nutrition and Food Supplements:

The net profit margin for Nutrition and Food Supplements is currently around -39%, with the highest operating expenses among all business lines. To improve this, consider the following strategies:

  1. Cut Costs and Adjust Prices: Identify ways to reduce expenses and set competitive prices that meet market demand.
  2. Increase Marketing Efforts: Enhance promotional activities with special offers and loyalty programs to attract more customers.
  3. Match Products to Market Needs: Conduct market research to understand customer preferences and consider expanding the product range to include trending flavors or items.
  4. Track Performance and Gain Insights: Regularly monitor financial performance and use customer surveys to gather insights on preferences and needs.

ZoomCharts visuals used

Drill Down Combo Bar PRO Drill Down Combo Bar PRO
Drill Down Donut PRO Drill Down Donut PRO

Need help?

Send your question to ZoomCharts assistant, and we will respond to you as soon as possible.

Contact Us

Mobile view allows you to interact with the report. To Download the template please switch to desktop view.

Report Overhaul

ZoomCharts Academy

Learn ZoomCharts with experts and become certified!

Go to Academy!
Report Overhaul

Was this helpful? Thank you for your feedback!

Sorry about that.

How can we improve it?

Velocity Edge -Financial Analysis

Share

ZoomCharts

Welcome to ZoomCharts

You’re almost there! Create an account to keep your saved reports.

or
Sign up with Microsoft

Verify your email address

We have sent a code to your email address. Please input the code below.

Didn't receive code? Request again (after 30 seconds)

Already have an account? Log in

ZoomCharts

Log in to your ZoomCharts account

Log in with Microsoft
or
Forgot password?

Reset your password

We'll email you instructions on how to reset your password

Don't have an account? Sign up

Please add credits

You have 0 available downloads.
Get more credits or upgrade your plan to continue.

View pricing
logo
[email protected]
+44 204 577 3993
logo

Products

Drill Down Network PRO Drill Down Waterfall PRO Drill Down Graph PRO Drill Down Combo PRO Drill Down Combo Bar PRO Drill Down Donut PRO Drill Down Pie PRO Drill Down TimeSeries PRO Drill Down Timeline PRO Drill Down Map PRO Drill Down Scatter PRO All Visuals

Resources

Report Examples Webinars Blog ZoomCharts Academy Visuals Gallery Documentation Custom Visual Development Subscribe to News

Solutions

Custom Visual Development

Company

Pricing About Us Partners Leave feedback Join PowerGroup EU Funding

Help

ZoomCharts Assistance Contact Sales Contact Support FAQ

Drill Down Network PRO Drill Down Waterfall PRO Drill Down Graph PRO Drill Down Combo PRO Drill Down Combo Bar PRO Drill Down Donut PRO Drill Down Pie PRO Drill Down TimeSeries PRO Drill Down Timeline PRO Drill Down Map PRO Drill Down Scatter PRO All Visuals

Report Examples Webinars Blog ZoomCharts Academy Visuals Gallery Documentation Custom Visual Development Subscribe to News

Custom Visual Development

Pricing About Us Partners Leave feedback Join PowerGroup EU Funding

ZoomCharts Assistance Contact Sales Contact Support FAQ
+44 204 577 3993
[email protected]

Ready to get in touch?

Contact our experts with any question about Power BI and ZoomCharts for Free!

Contact us

© 2025, Data Visualization Software Lab

U.S. Patents No. 11,645,343; 11,921,804; 12,346,389

Cookies
Privacy Policy
Global
Legal
Patent
warning

Error message

success

Success info: Done!

ZoomCharts AI Assistant

We noticed you're using an old OS version.

For the best experience, we recommend upgrading to ensure that all website features display correctly.

Cookie settings

We use necessary cookies for site functionality, as well as statistic, marketing, and preference cookies to enhance your experience. For more information and to manage your preferences, please visit our Cookie policy