1576
Power BI Sports Company Financial Performance Dashboard
Power BI Sports Company Financial Performance Dashboard
More Report pages
Report Author: Balu Chelluri
1576
Share template with others
Summary
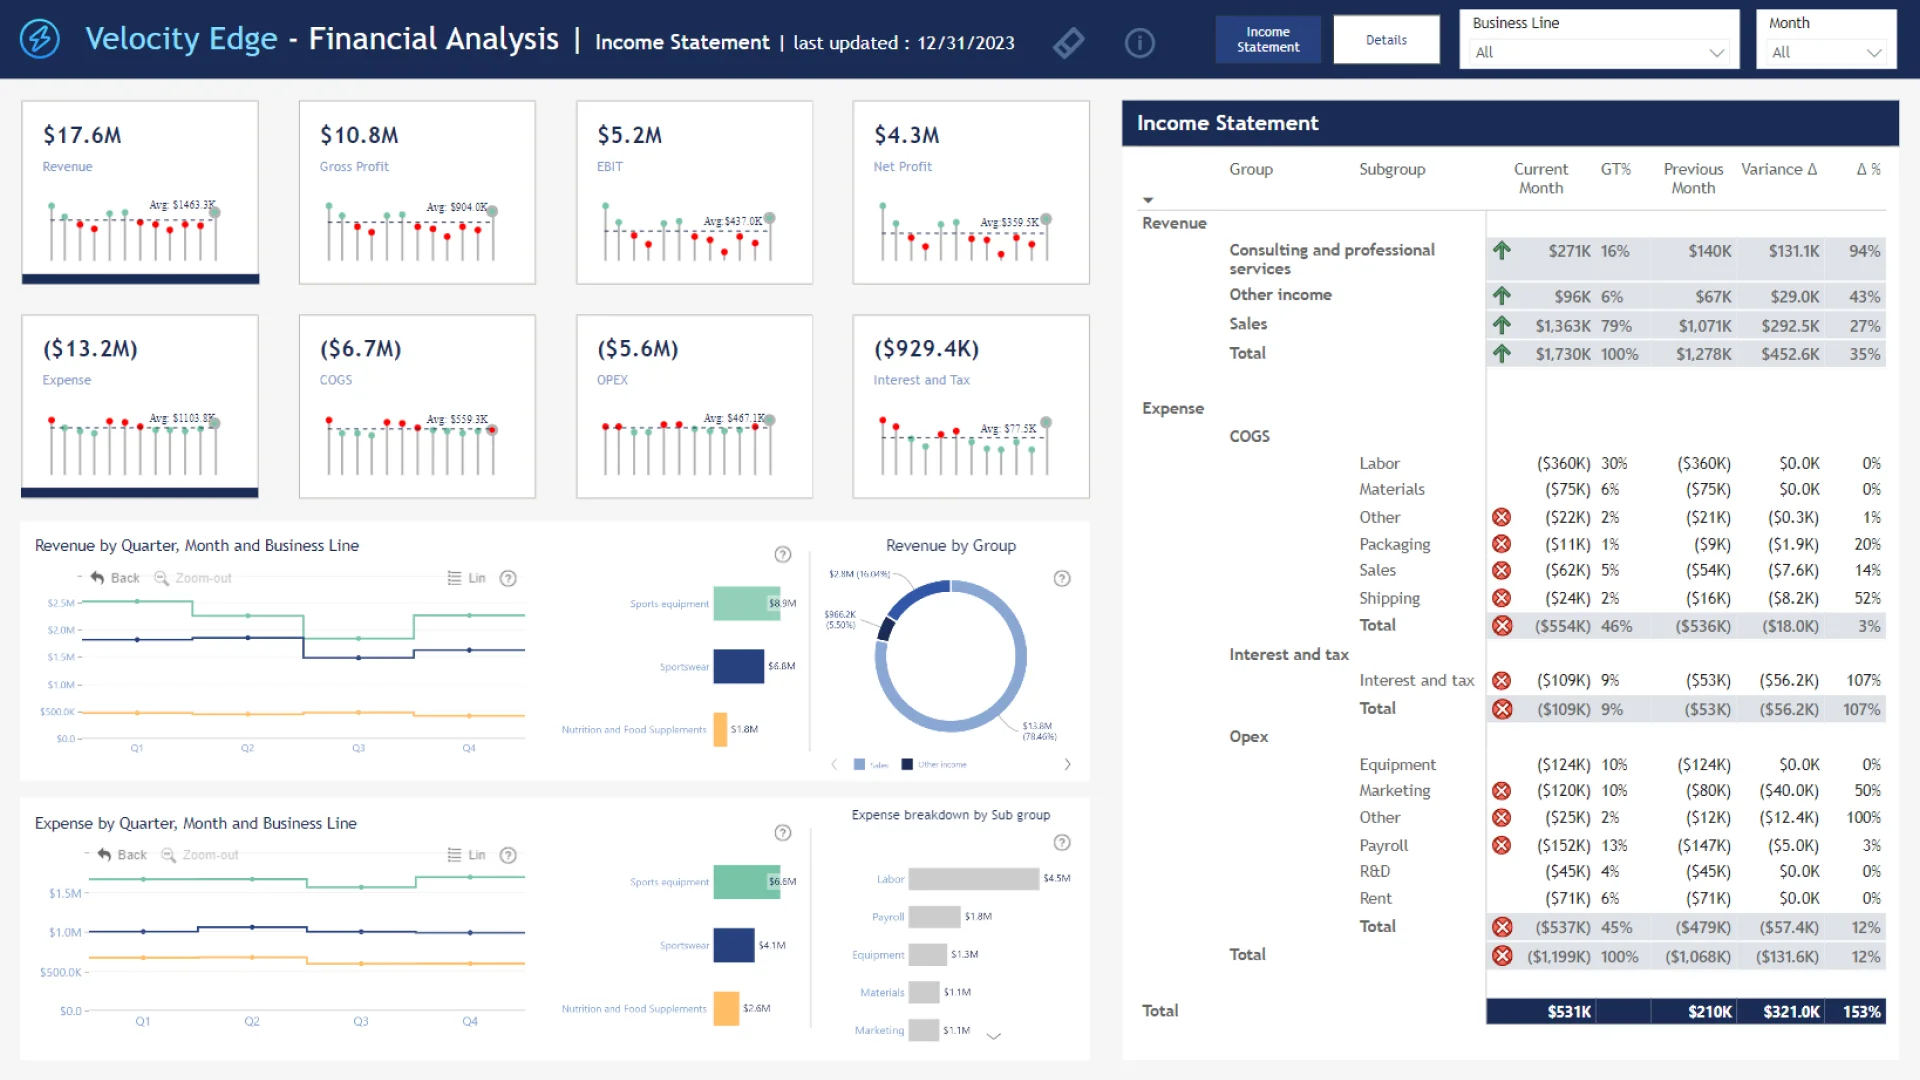
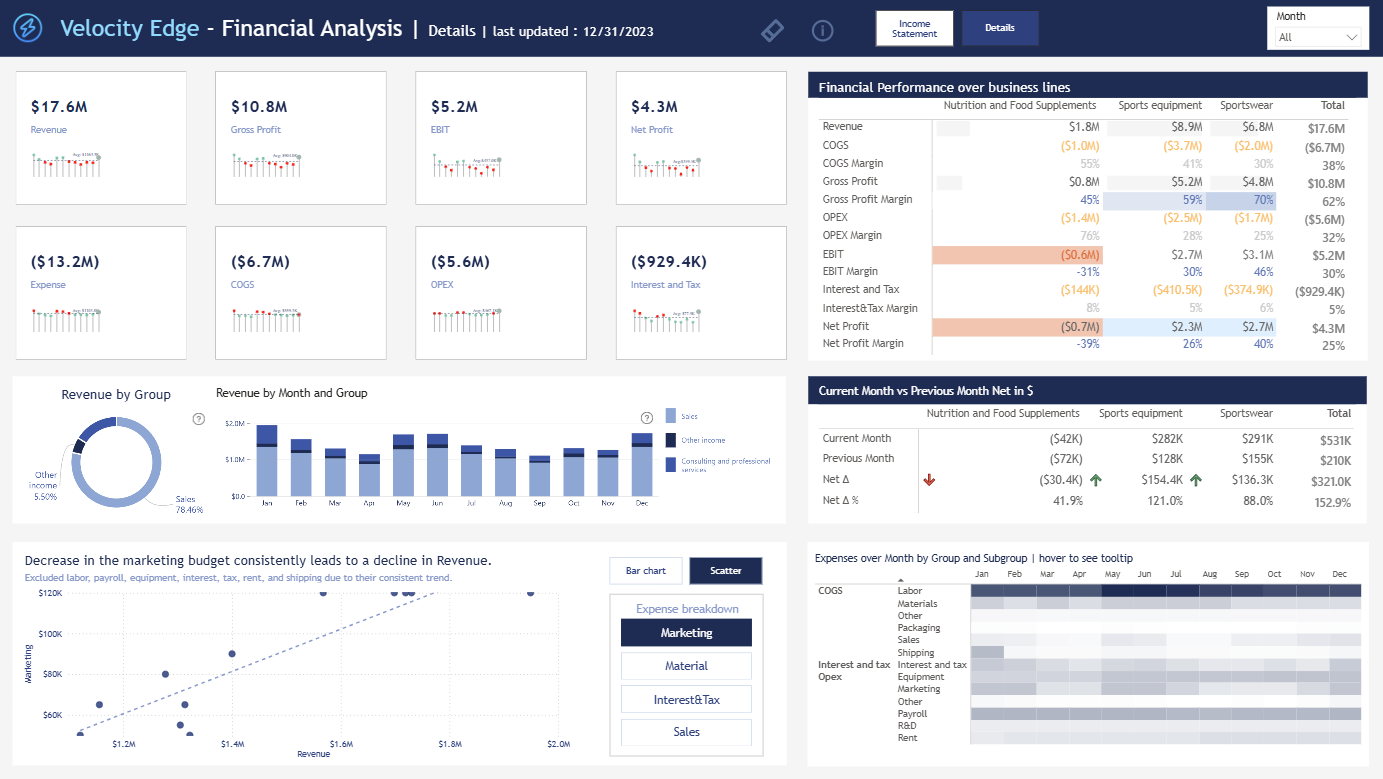
This Power BI financial performance dashboard analyzes revenue, costs, expenses, profit, and margins across the business lines of Velocity Edge, a fictional U.S. sports company. It helps users compare financial results for sports equipment, sportswear, nutrition products, and other areas of the business.
Created by Balu Chelluri using the Fitness Company Finance dataset, the two-page report was submitted to the August 2024 Onyx Data DataDNA ZoomCharts Mini Challenge. It combines category, timeline, and composition visuals for interactive financial analysis.
Key Insights of the Power BI Sports Company Financial Performance Dashboard
- Financial performance: Track revenue, cost of goods sold, gross profit, operating expenses, EBIT, and net profit.
- Business line profitability: Compare revenue and profit across sports equipment, sportswear, nutrition products, and other categories.
- Cost structure: Examine how COGS, sales expenses, operating expenses, interest, and tax affect financial results.
- Profit margins: Review margins as a percentage of revenue and identify categories with weaker profitability.
- Seasonal patterns: Explore monthly performance and potential changes associated with major U.S. sports seasons.
- Performance gaps: Identify cases where strong revenue does not translate into strong net profit because of higher costs or expenses.
How to Use This Power BI Sports Company Financial Performance Dashboard
Preview the report online and use the timeline, category charts, and composition visuals to compare business lines and financial measures. Select a month or category to focus the analysis and investigate the factors affecting profitability.
Download the PBIX template and open it in Power BI Desktop to review the calculations, report structure, and drill-down settings. Replace the sample finance data with your own dataset, map the corresponding financial fields, refresh the model, and customize the dashboard for your organization.



4U Report Challenges
Participate in data challenges, build and submit reports to get free template downloads.
Join CommunityMobile view allows you to interact with the report. To Download the template please switch to desktop view.
How to use a PBIX template
Preview the interactive report, download the PBIX file, open it in Power BI Desktop, and replace the same data connection with your own dataset.
Preview and download
Explore the report online and download the PBIX template file.
Open in Power BI Desktop
Open the downloaded PBIX file in Power BI Desktop.
Connect your data
Replace the sample data source with your own dataset.
Refresh and adjust
Refresh the model and update fields or visual were needed.
Save and share
Save your report and publish it for your audience.


