881
TMDB Movies Report
TMDB Movies Report
Report Author: Aditi Bhadauria
881
Share template with others
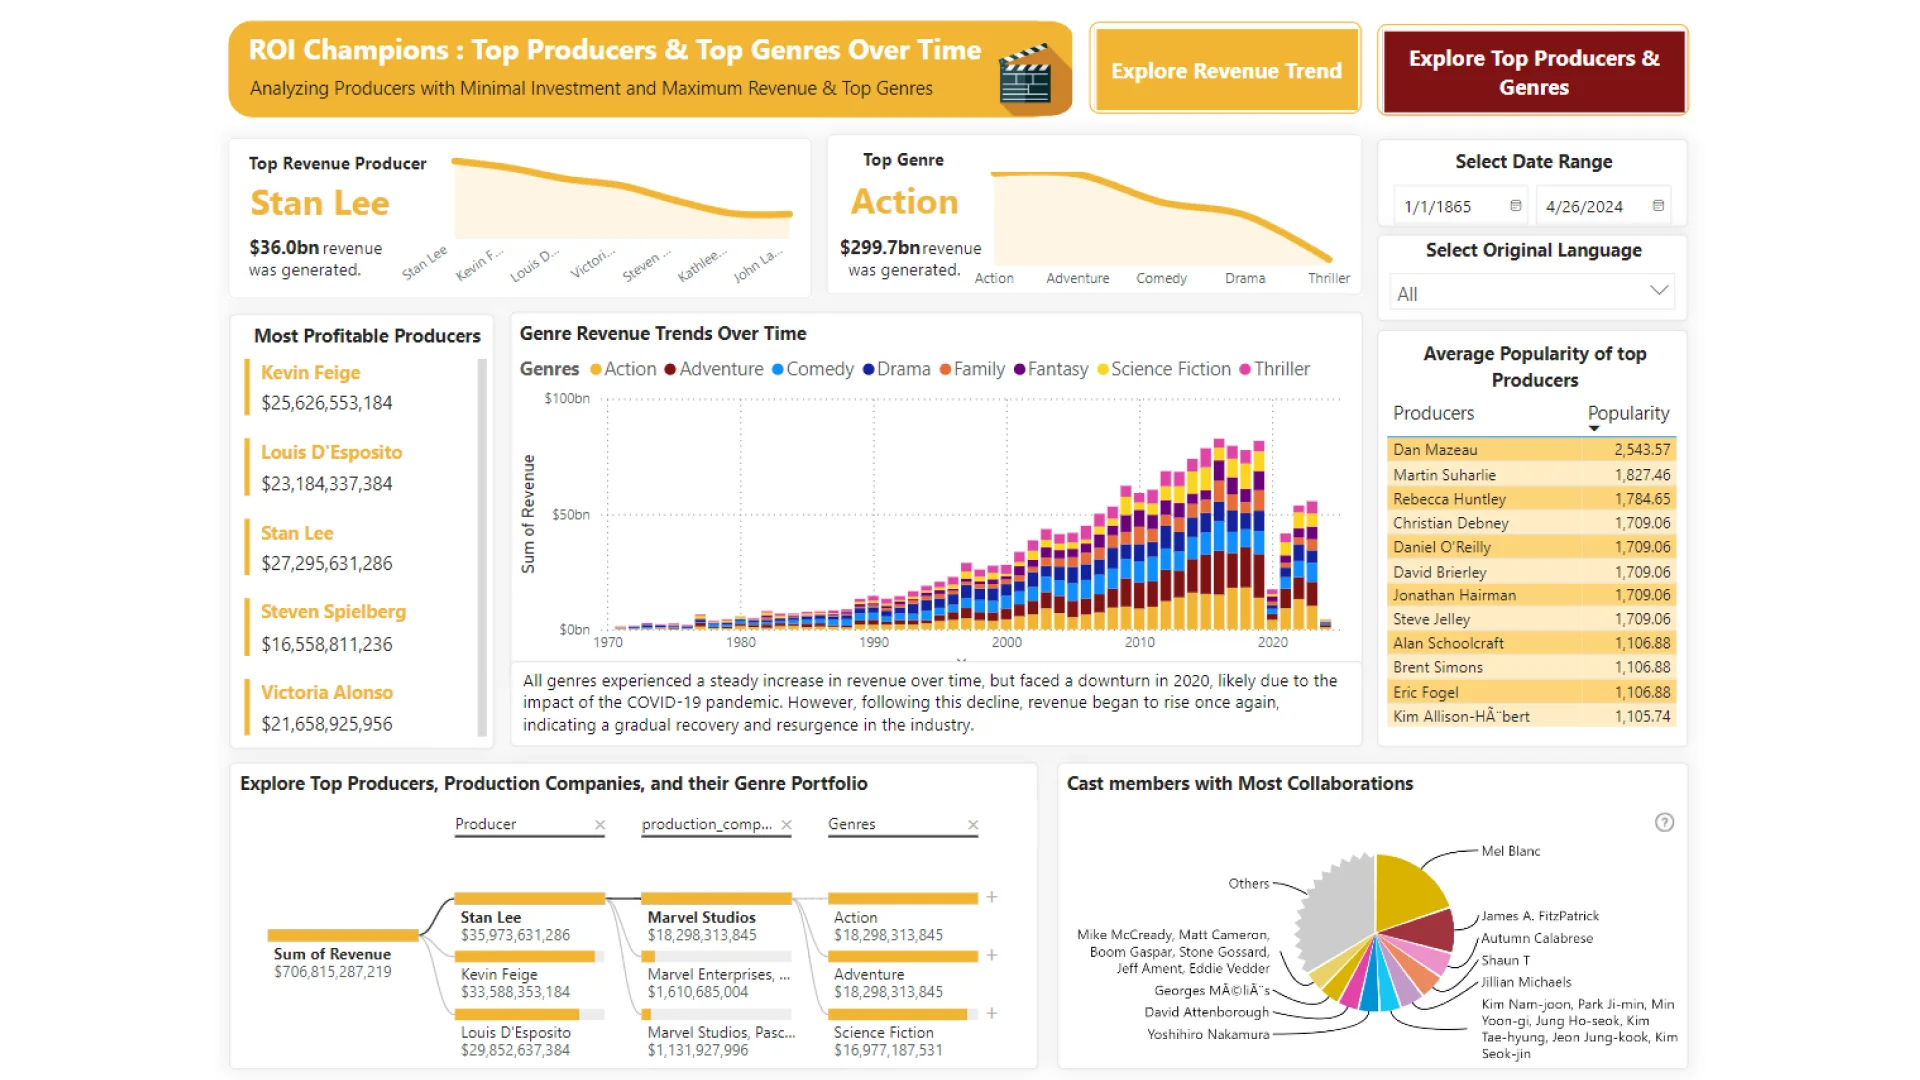
Report submitted for Onyx Data DataDNA ZoomCharts Mini Challenge, April 2024. The report was built based on The Movie Database dataset and includes ZoomCharts custom Drill Down PRO visuals for Power BI.
Author's description:
The report consists of 2 pages which gives information regarding the revenue trend over time and the popular producers, directors, cast, genres, etc. In the first line chart showing the top 5 revenue generating years, the year with the highest revenue needs to be clicked on so that the rest of the visuals show specific information for that year, else those visuals will show overall insights.
4U Report Challenges
Participate in data challenges, build and submit reports to get free template downloads.
Join CommunityMobile view allows you to interact with the report. To Download the template please switch to desktop view.

Was this helpful? Thank you for your feedback!
Sorry about that.
How can we improve it?