1097
Supply Chain Management
Supply Chain Management
More Report pages
Report Author: Oumar Bocoum
1097
Share template with others
Report submitted for Onyx Data DataDNA ZoomCharts Mini Challenge, November 2024. The report is based on the Supply Chain Analysis dataset and includes ZoomCharts custom Drill Down PRO visuals for Power BI.
Author's description:
Comprehensive Insights into Performance, Quality, and Costs This dynamic and interactive Supply Chain Management Dashboard is designed to provide an all-encompassing view of the supply chain operations. By leveraging advanced analytics and engaging visuals, the dashboard offers actionable insights into key performance areas, enabling efficient decision-making and process optimization.
Dashboard Overview:
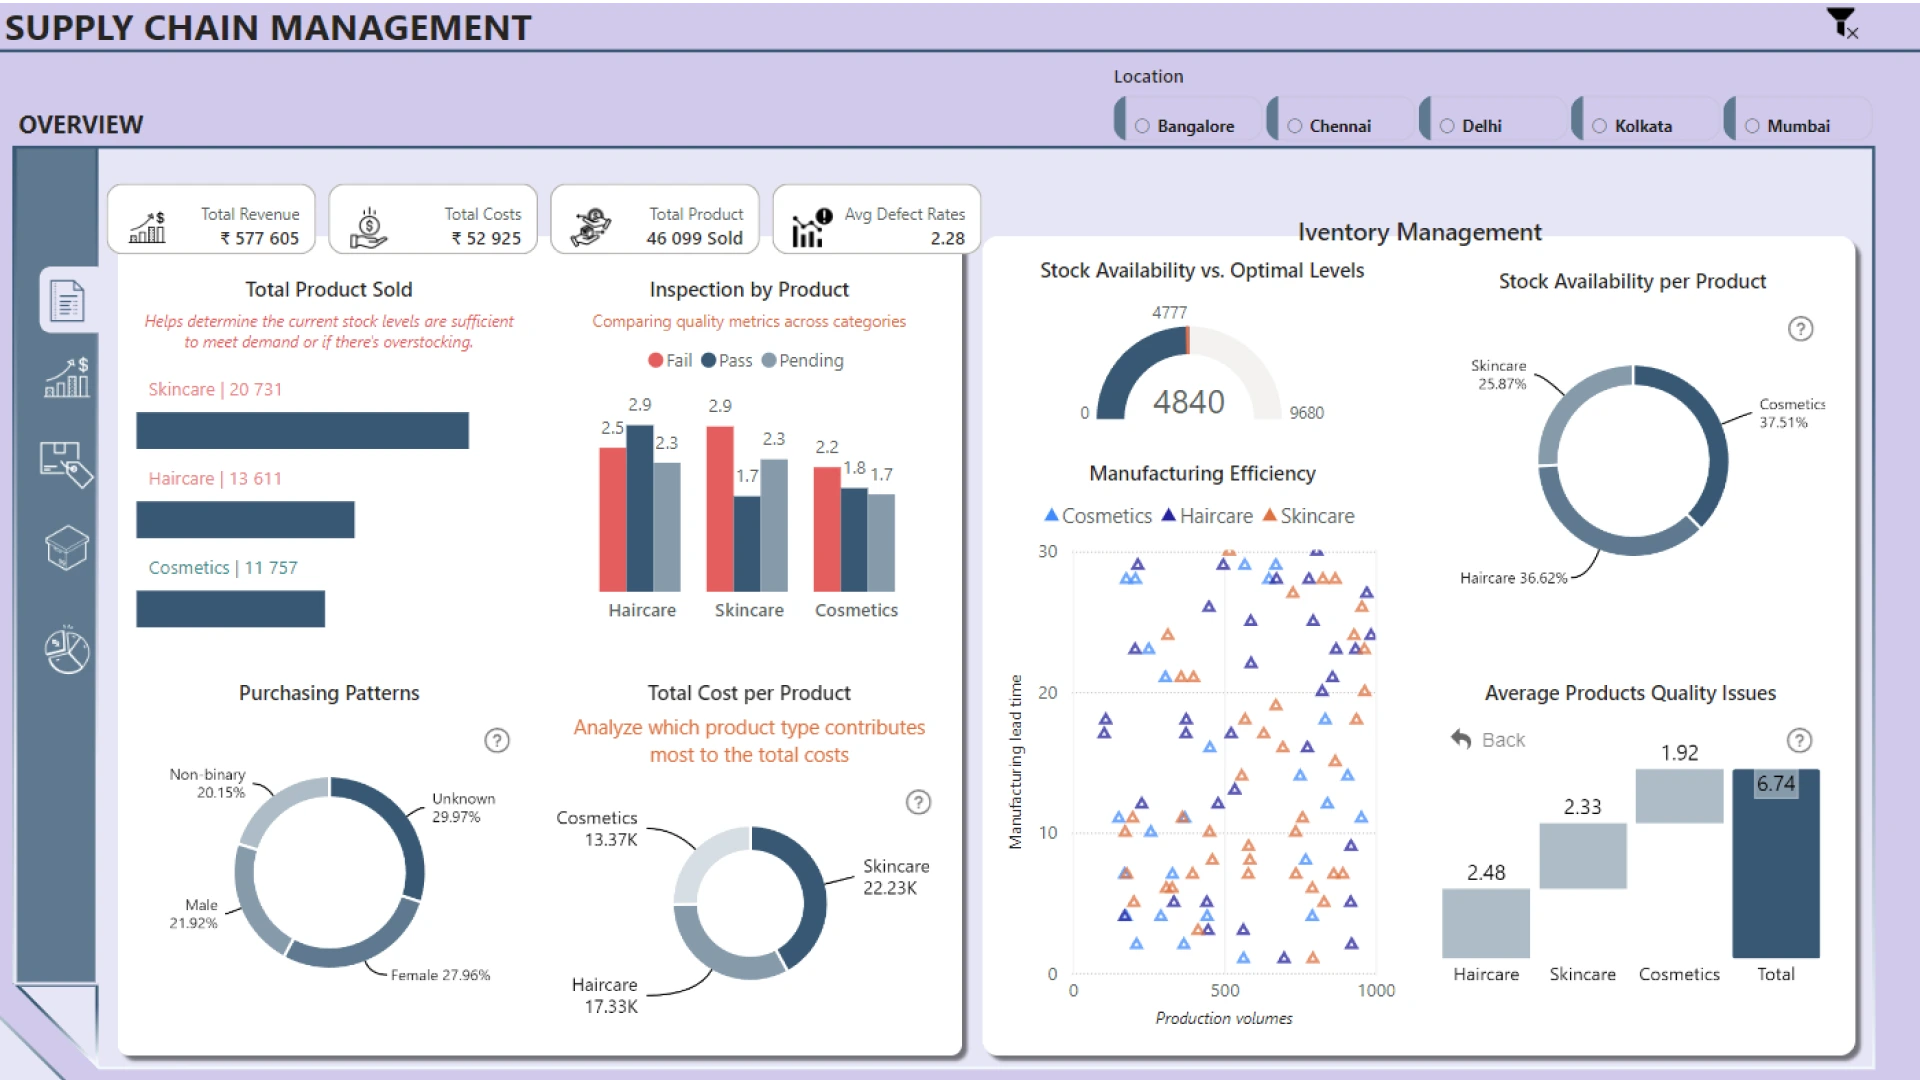
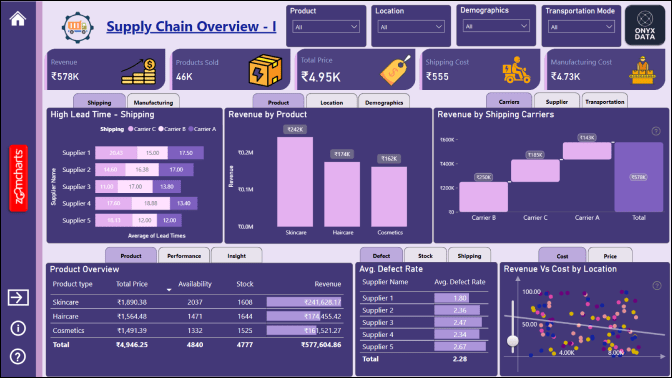
1. Overview Page:
o Displays key performance indicators (KPIs) such as Total Revenue (₹577,605), Total Costs (₹52,925), and Average Defect Rates (2.28%).
o Provides insights into total product sales by type, ensuring stock levels align with demand.
o Visualizes inspection results by product type (pass, fail, pending) and highlights areas for quality improvement.
o Includes purchasing patterns analysis to understand customer behavior and stock allocation.
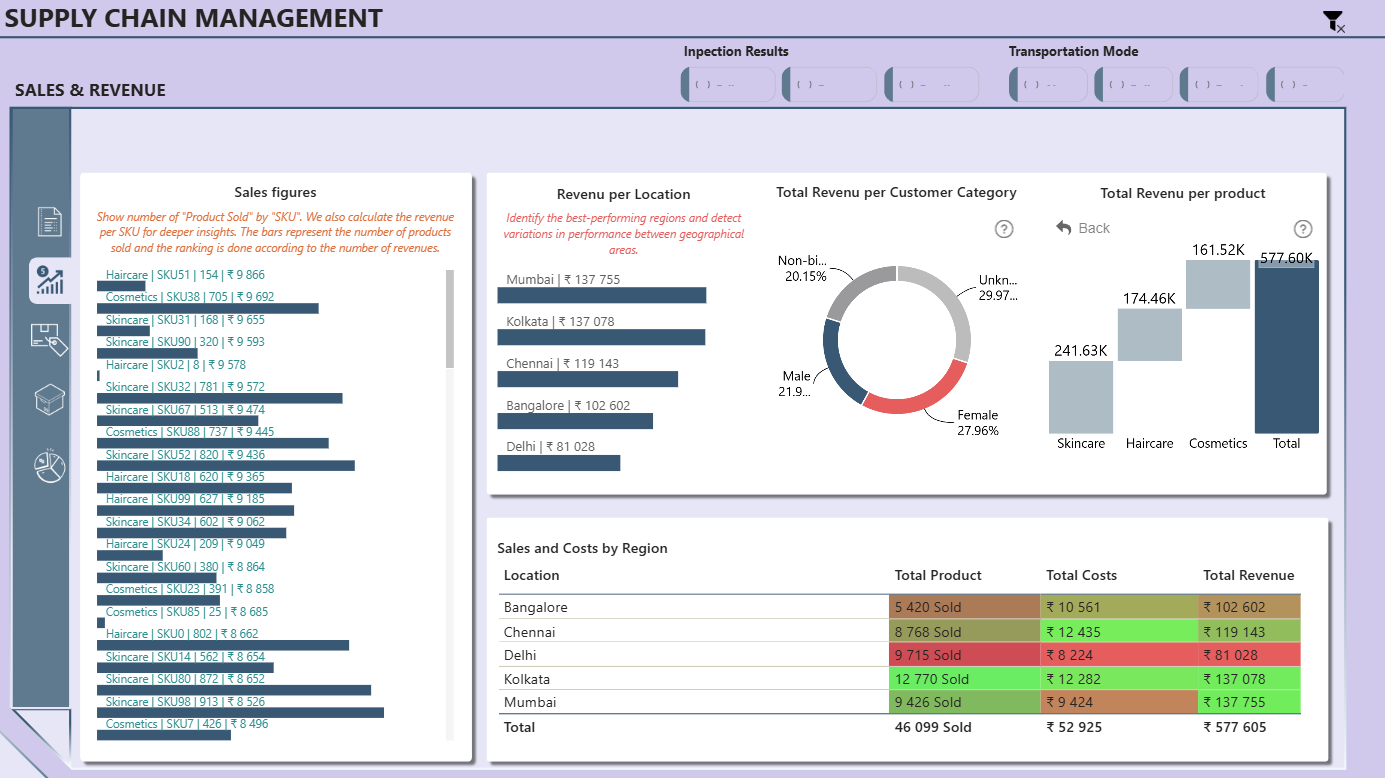
2. Sales & Revenue Page:
o Highlights sales figures by SKU for granular performance tracking.
o Provides revenue breakdown by location (Mumbai, Kolkata, Chennai, etc.), enabling regional analysis of profitability.
o Illustrates revenue per customer category (Non-binary, Female, Male, Unknown) for demographic insights.
o Summarizes sales and costs by region, providing a clear picture of regional profitability.
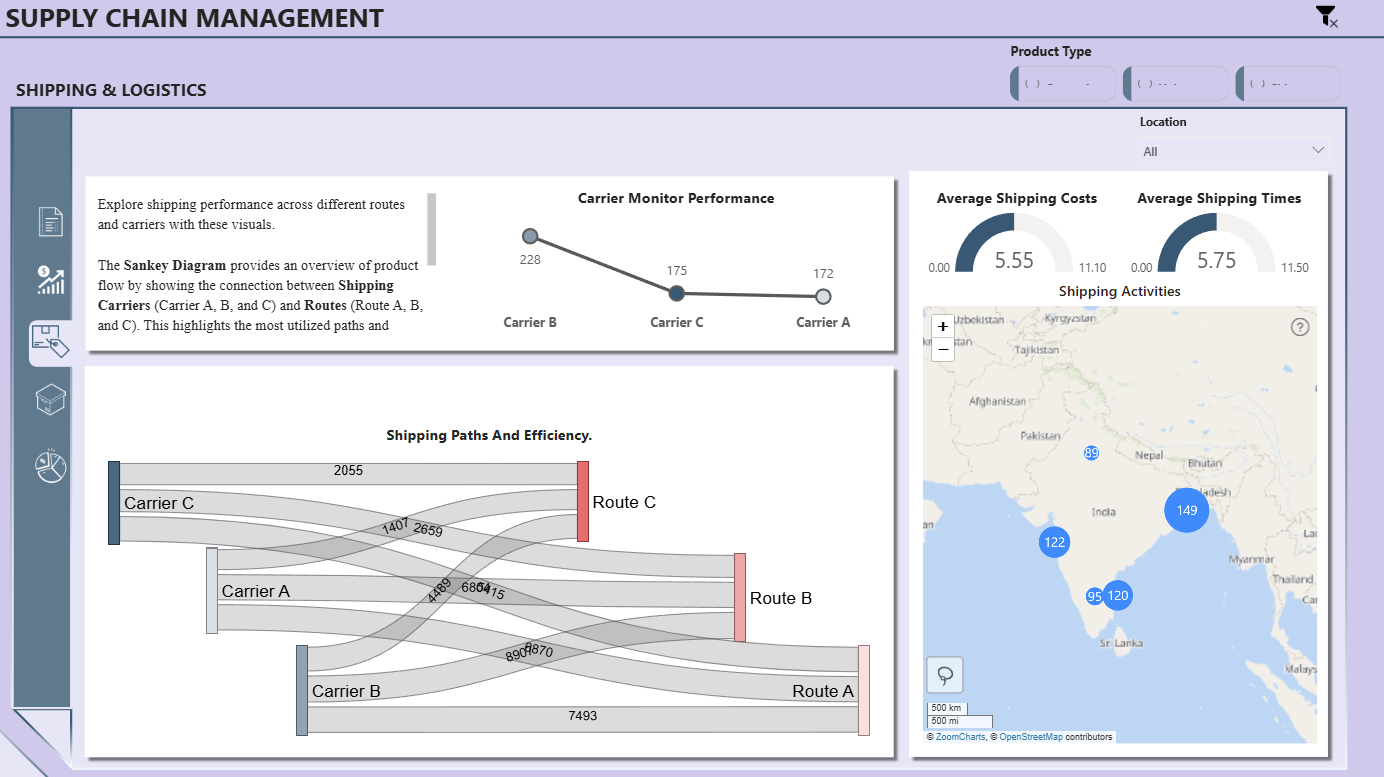
3. Shipping & Logistics Page:
o Utilizes a Sankey Diagram to analyze the flow of goods between shipping carriers and routes, identifying the most efficient paths.
o Displays average shipping costs and times to evaluate logistical efficiency.
o Interactive maps show shipping activities across regions, highlighting high-performing and cost-intensive areas.
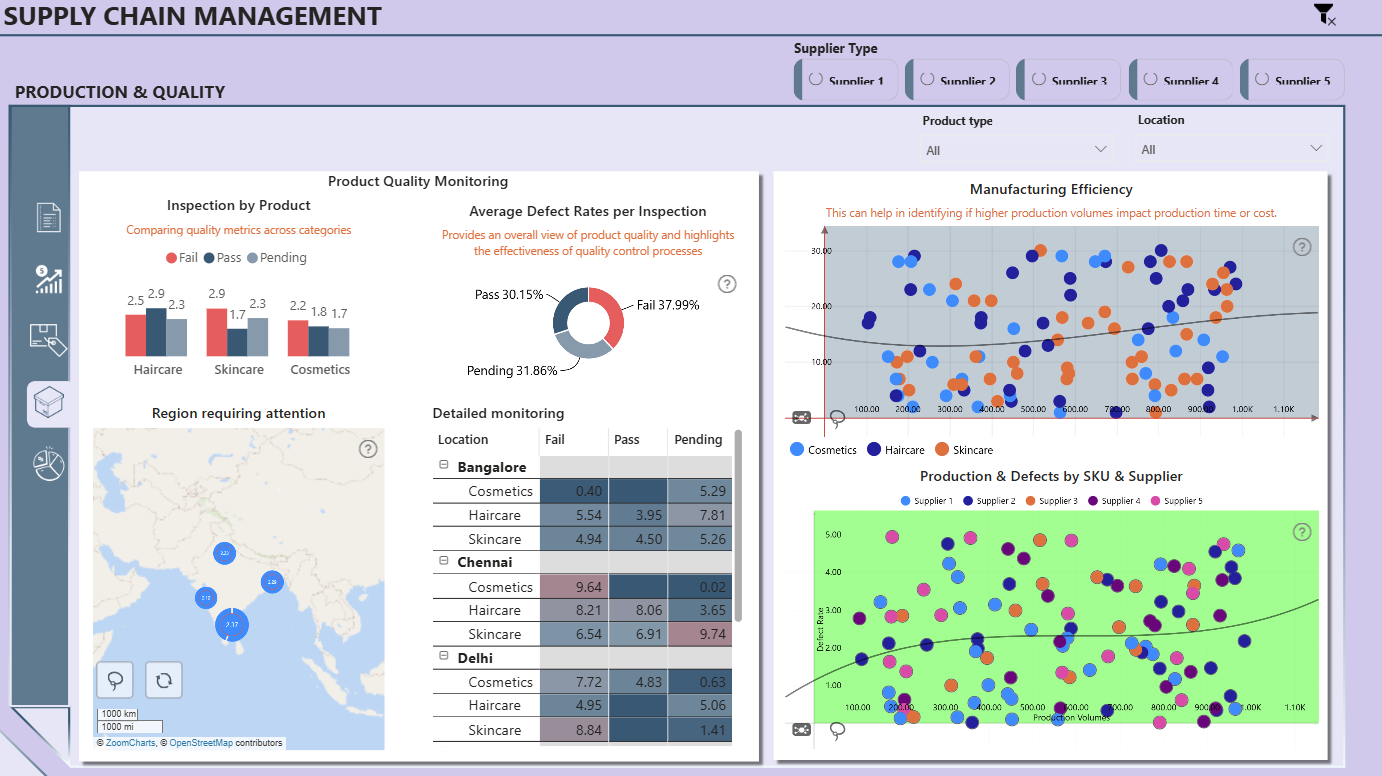
4. Production & Quality Page:
o Tracks inspection results by product type to ensure adherence to quality standards.
o Displays manufacturing efficiency through scatter plots, correlating production volumes with manufacturing lead time.
o Regional maps and detailed tables highlight locations requiring attention for quality issues.
o A breakdown of production and defect rates by supplier and SKU helps identify underperforming suppliers.
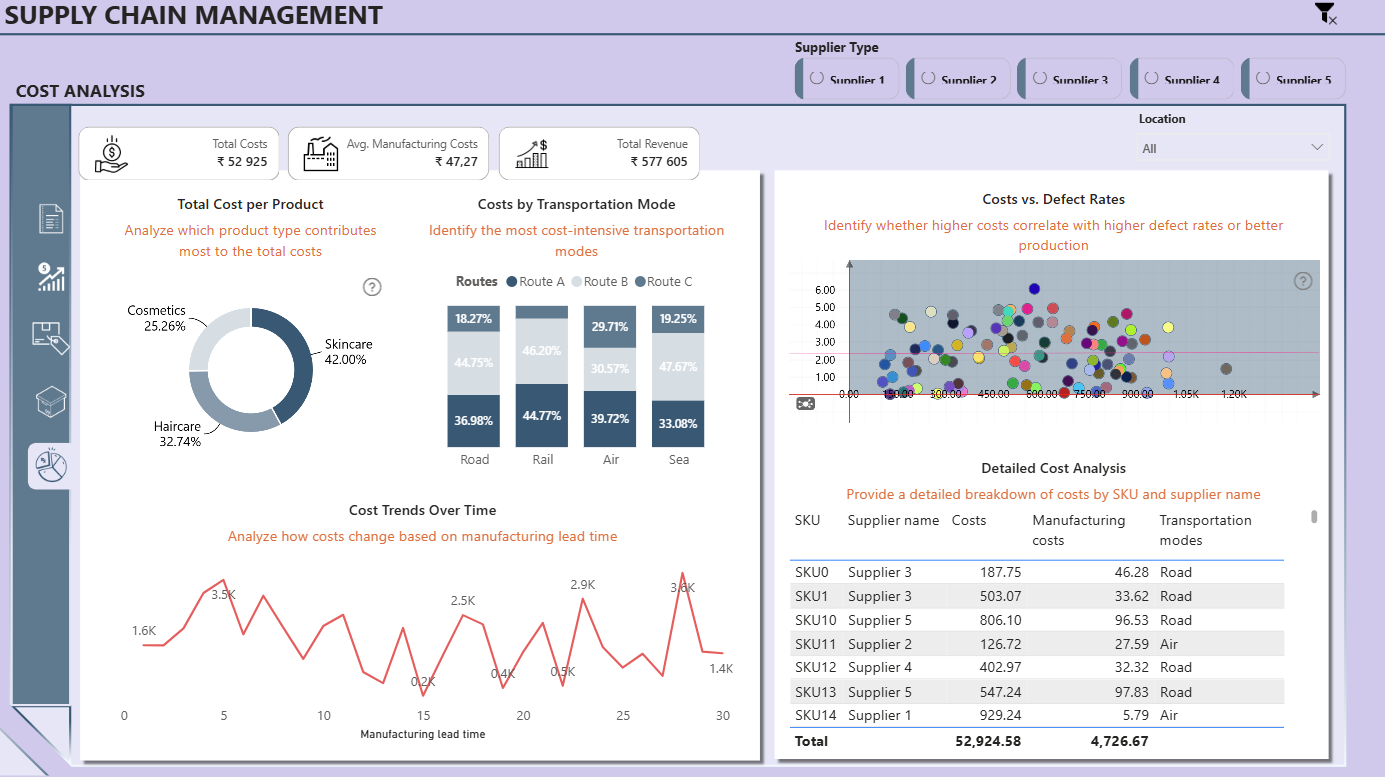
5. Cost Analysis Page:
o Analyzes cost distribution by product type and transportation modes (road, rail, air, sea) to identify cost drivers.
o Tracks cost trends over time to detect inefficiencies in production or logistics.
o Visualizes the relationship between costs and defect rates, enabling process optimization to reduce waste.
o Provides a detailed table for granular analysis of costs by supplier, manufacturing costs, and transportation modes.
ZoomCharts visuals used
4U Report Challenges
Participate in data challenges, build and submit reports to get free template downloads.
Join CommunityMobile view allows you to interact with the report. To Download the template please switch to desktop view.
Was this helpful? Thank you for your feedback!
Sorry about that.
How can we improve it?