713
Spotify Most Streamed Songs _ Ananya Dutta
Spotify Most Streamed Songs _ Ananya Dutta
Report Author: Ananya Dutta
713
Share template with others
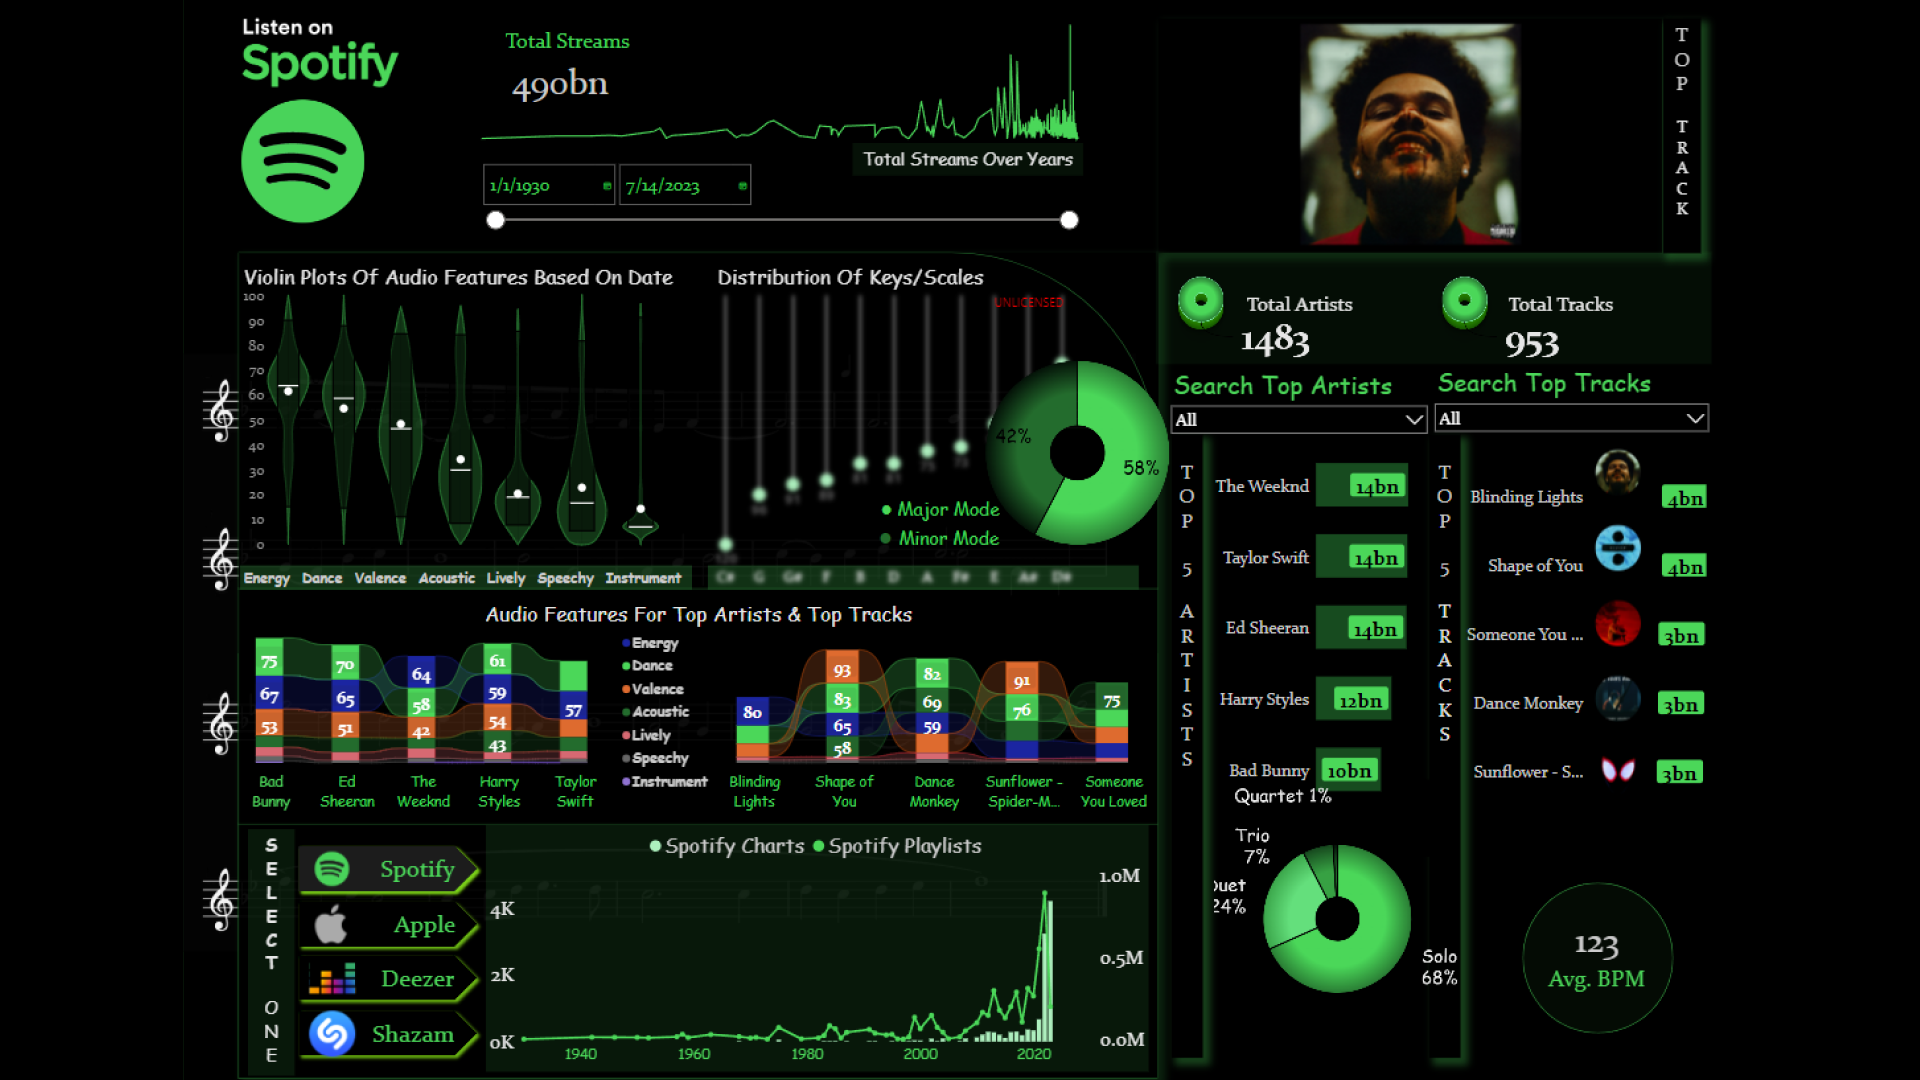
Report submitted for Onyx Data DataDNA ZoomCharts Mini Challenge, October 2023. The report was built based on Spotify dataset and includes ZoomCharts custom Drill Down PRO visuals for Power BI.
Author's description:
This Power BI report pertains to the #DataDNA October 2023 challenge focusing on Spotify's Most Streamed Songs, organized by Onyx Data, ZoomCharts, Data Career Jumpstart, novyPro, DATAcated, and The AI Journal. In this report, I have identified top artists and tracks with the highest stream counts, showcased and analyzed scales, modes, and various audio features across different release years, popular artists, and songs. Additionally, I have examined and presented charts and playlists from other apps to provide a comparative perspective.
ZoomCharts visuals used
4U Report Challenges
Participate in data challenges, build and submit reports to get free template downloads.
Join CommunityMobile view allows you to interact with the report. To Download the template please switch to desktop view.
Was this helpful? Thank you for your feedback!
Sorry about that.
How can we improve it?