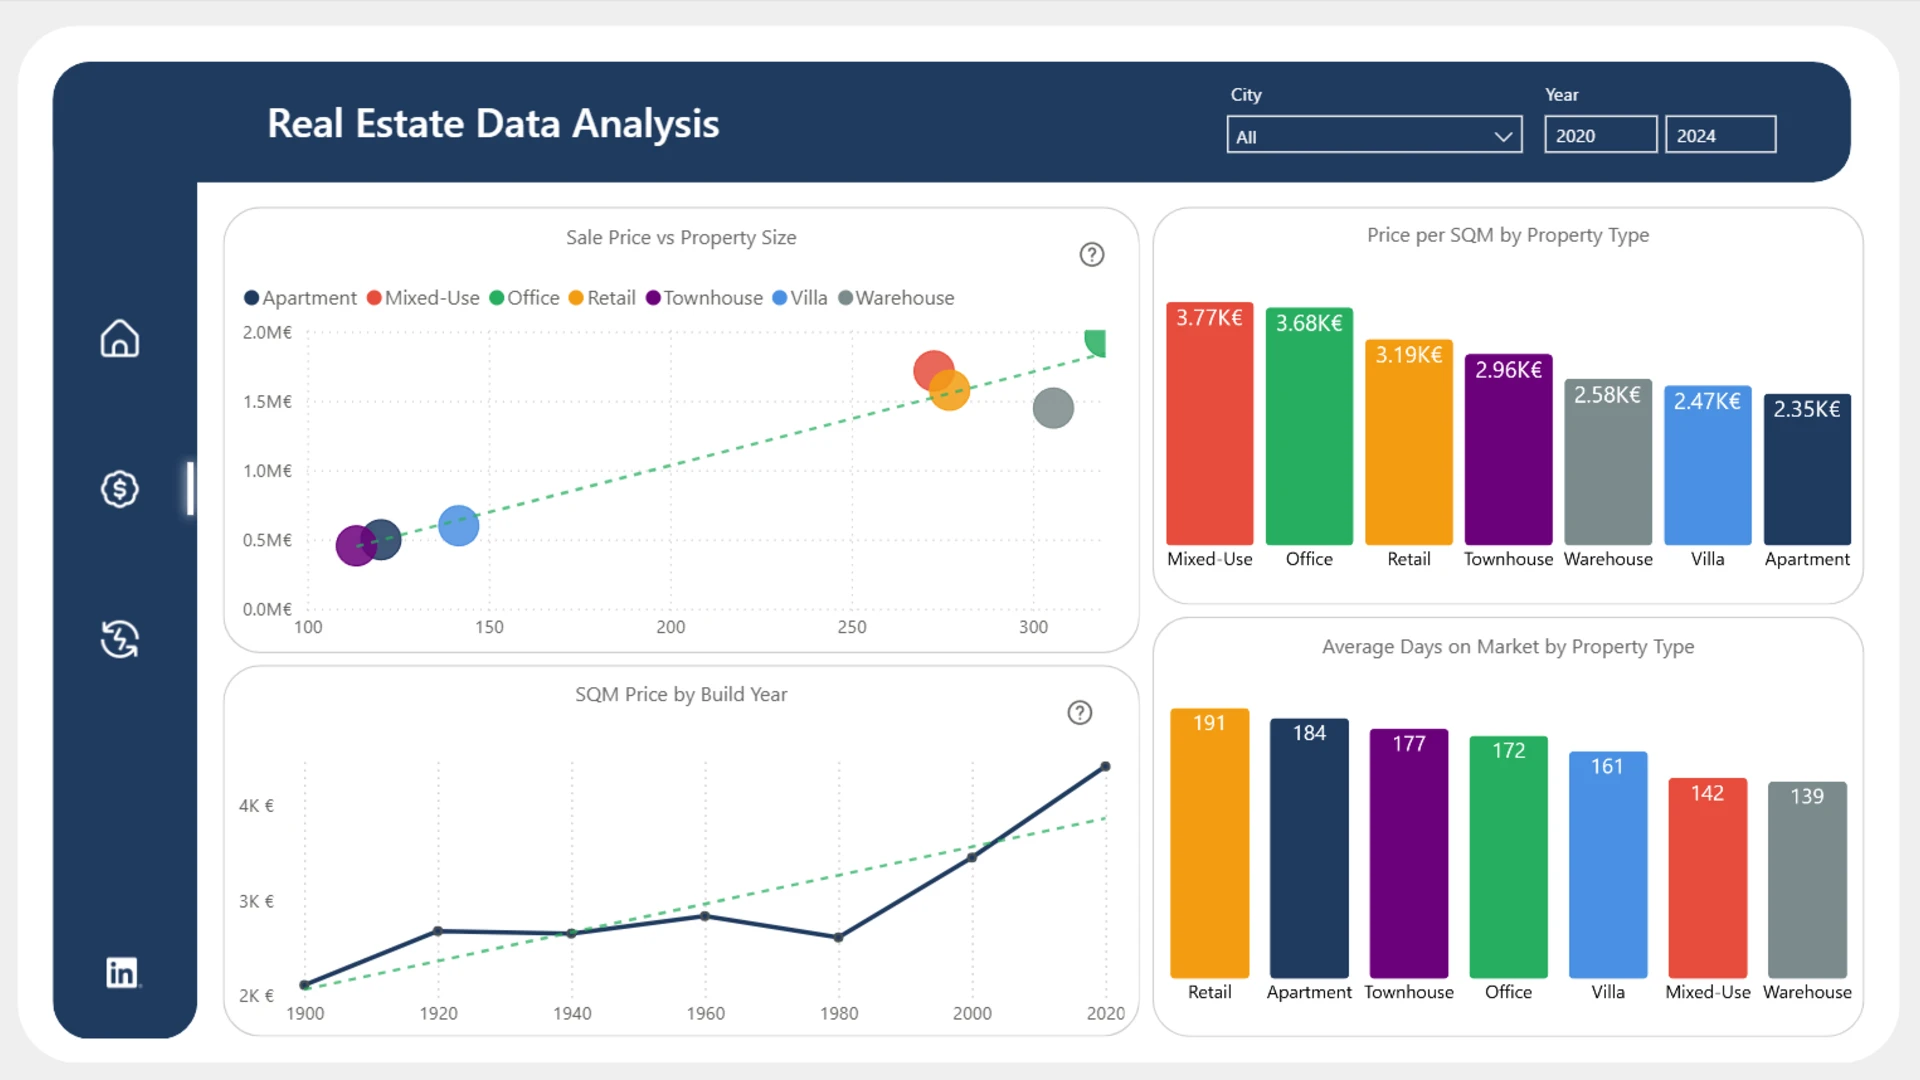
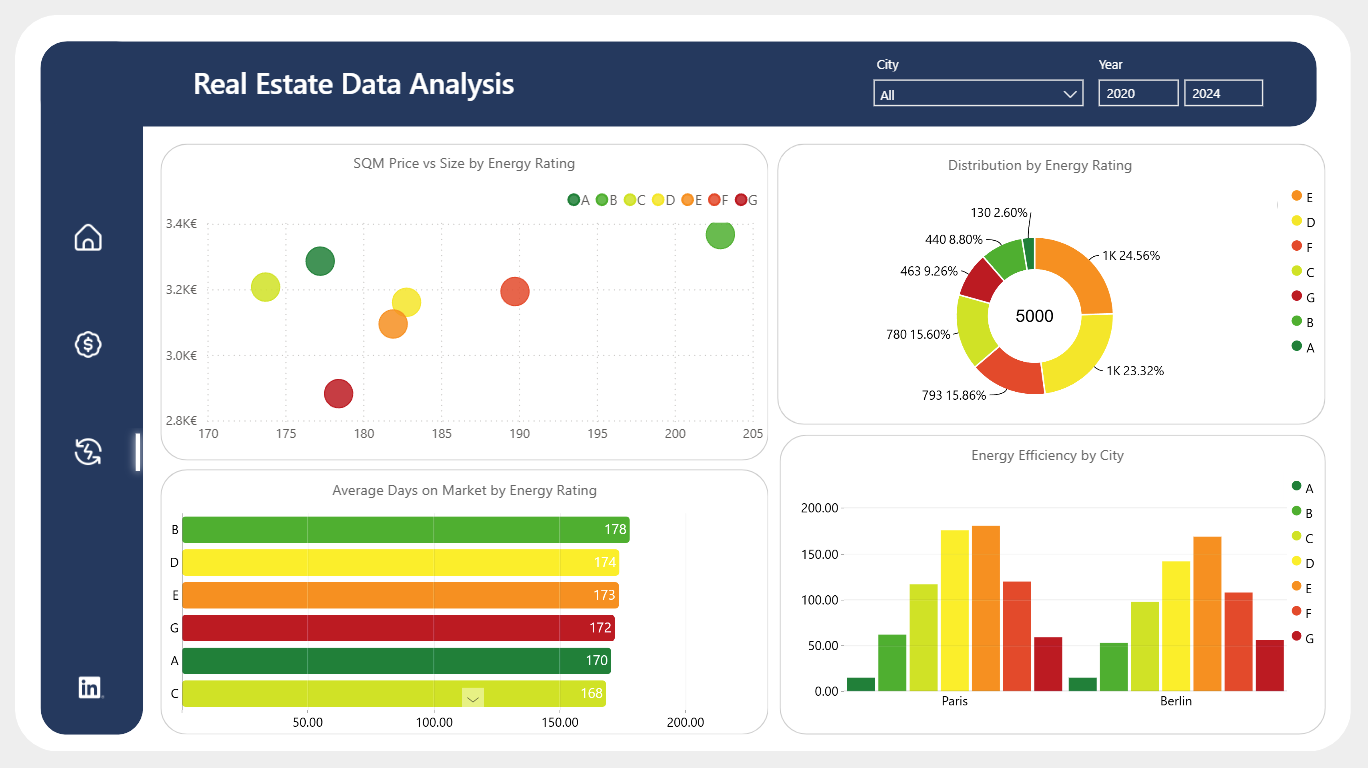
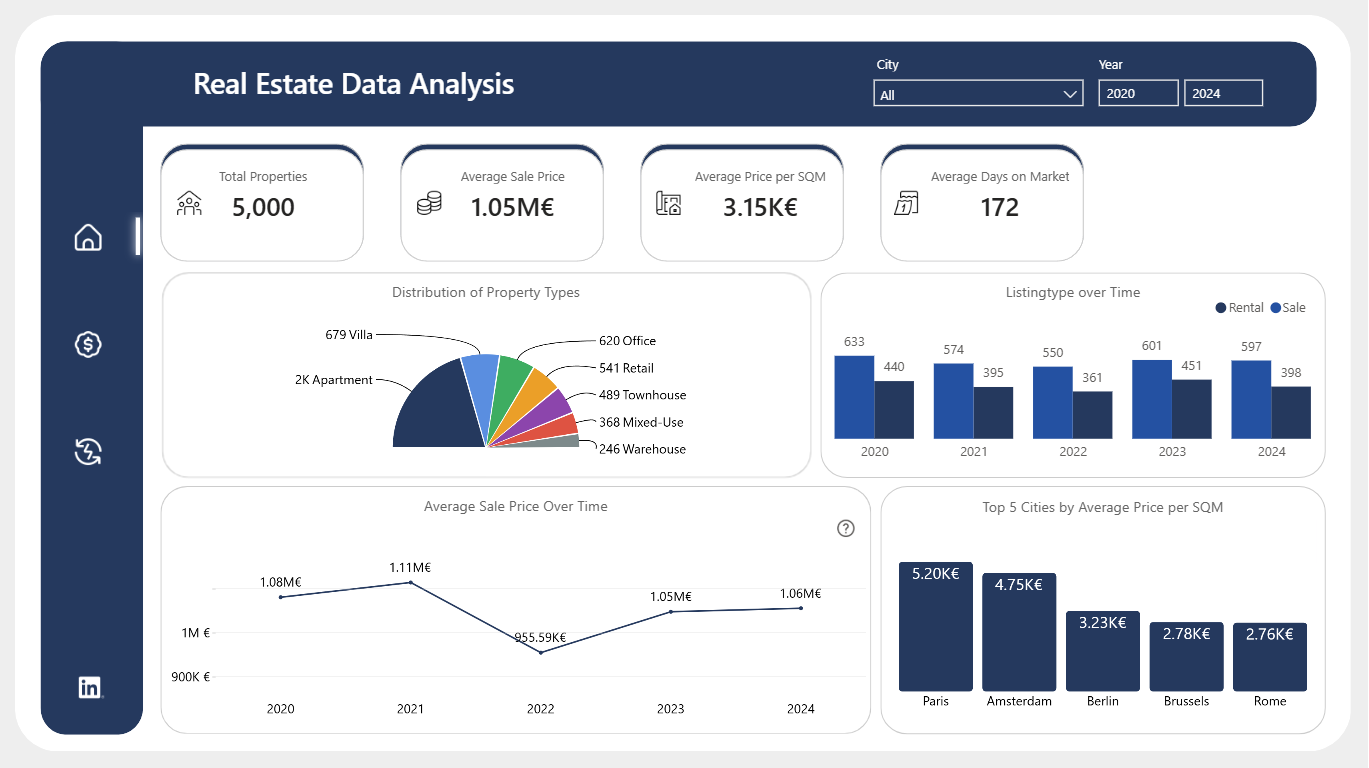
This interactive Power BI report explores the European Real Estate Market Analytics dataset using ZoomCharts Drill Down custom visuals for Power BI. It highlights property prices, price per square meter, listing activity, and property characteristics across countries and cities, helping users identify market trends, compare locations, and evaluate investment opportunities.
The report was submitted to the FP20 Analytics ZoomCharts Data Challenge #36 (March – April 2026).
Author’s Description:
I worked on the FP20 Analytics Challenge 36, where I built a compact Power BI dashboard to analyze the European real estate market from an investor’s perspective. The focus was on uncovering market dynamics and translating data into actionable insights rather than simply visualizing listings.
The dashboard highlights key aspects such as property price distribution, market activity across cities, and how factors like size and energy efficiency impact pricing. It provides a clear, visual tool to identify investment opportunities, understand pricing structures, and analyze market trends.