571
Property Value & Market Activity Dashboard 4
Property Value & Market Activity Dashboard 4
Report Author: Victor Nwigwe
571
Share template with others
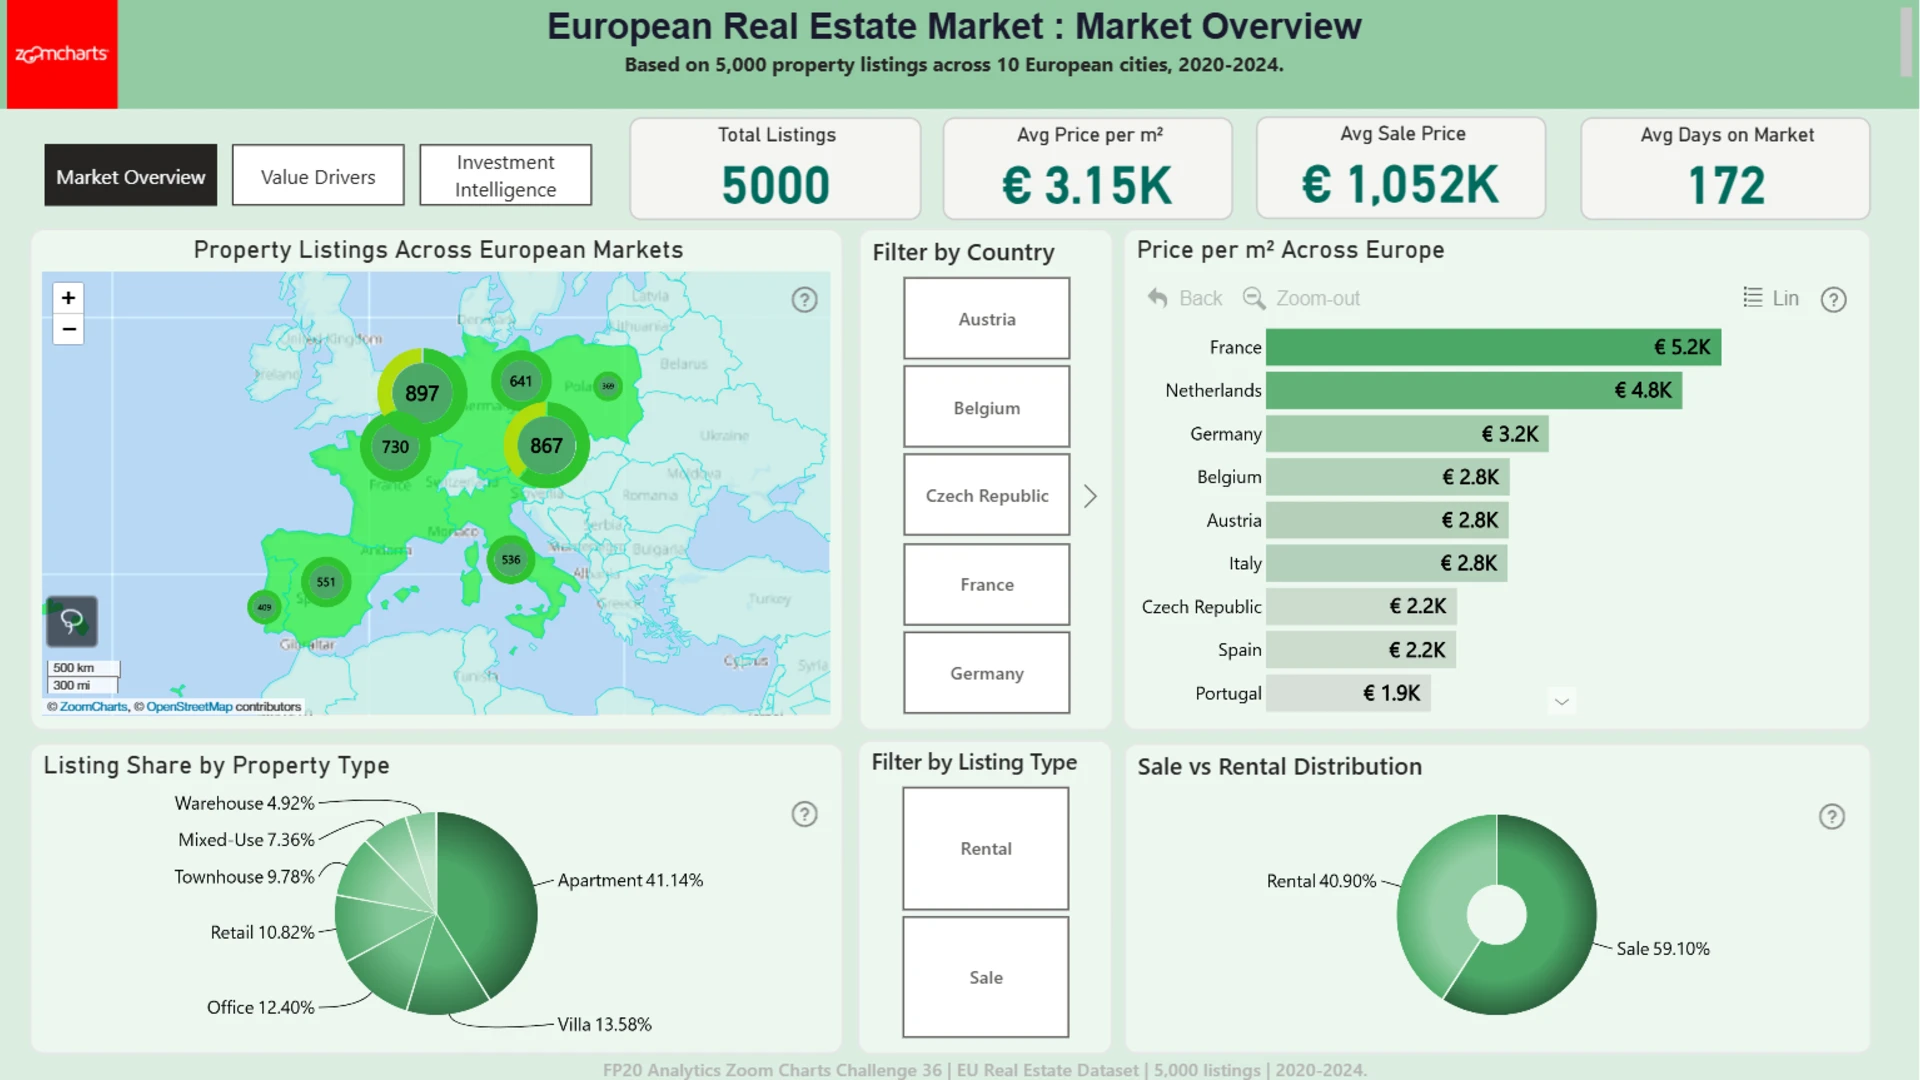
This interactive Power BI report explores the European Real Estate Market Analytics dataset using ZoomCharts Drill Down custom visuals for Power BI. It highlights property prices, price per square meter, listing activity, and property characteristics across countries and cities, helping users identify market trends, compare locations, and evaluate investment opportunities.
The report was submitted to the FP20 Analytics ZoomCharts Data Challenge #36 (March – April 2026).
Author’s Description:
This report explores 5,000 European property listings across 10 cities to help real estate investors and analysts understand where value lives and why. Built across three pages, it moves from market geography to value drivers to investment signals, each page answering one focused question. France and the Netherlands lead on price per sqm, while Poland sits at the bottom. Elevator-equipped properties carry a 64% price premium, the strongest single signal in the dataset. Amsterdam shows the highest prices but the slowest turnover, a possible overvaluation flag, while Prague and Warsaw move fastest and remain comparatively affordable.
ZoomCharts visuals used
4U Report Challenges
Participate in data challenges, build and submit reports to get free template downloads.
Join CommunityMobile view allows you to interact with the report. To Download the template please switch to desktop view.


Was this helpful? Thank you for your feedback!
Sorry about that.
How can we improve it?