779
Project Planning Power BI Report 2
Project Planning Power BI Report 2

More Report pages
Report Author: Nikhil L
779
Share template with others
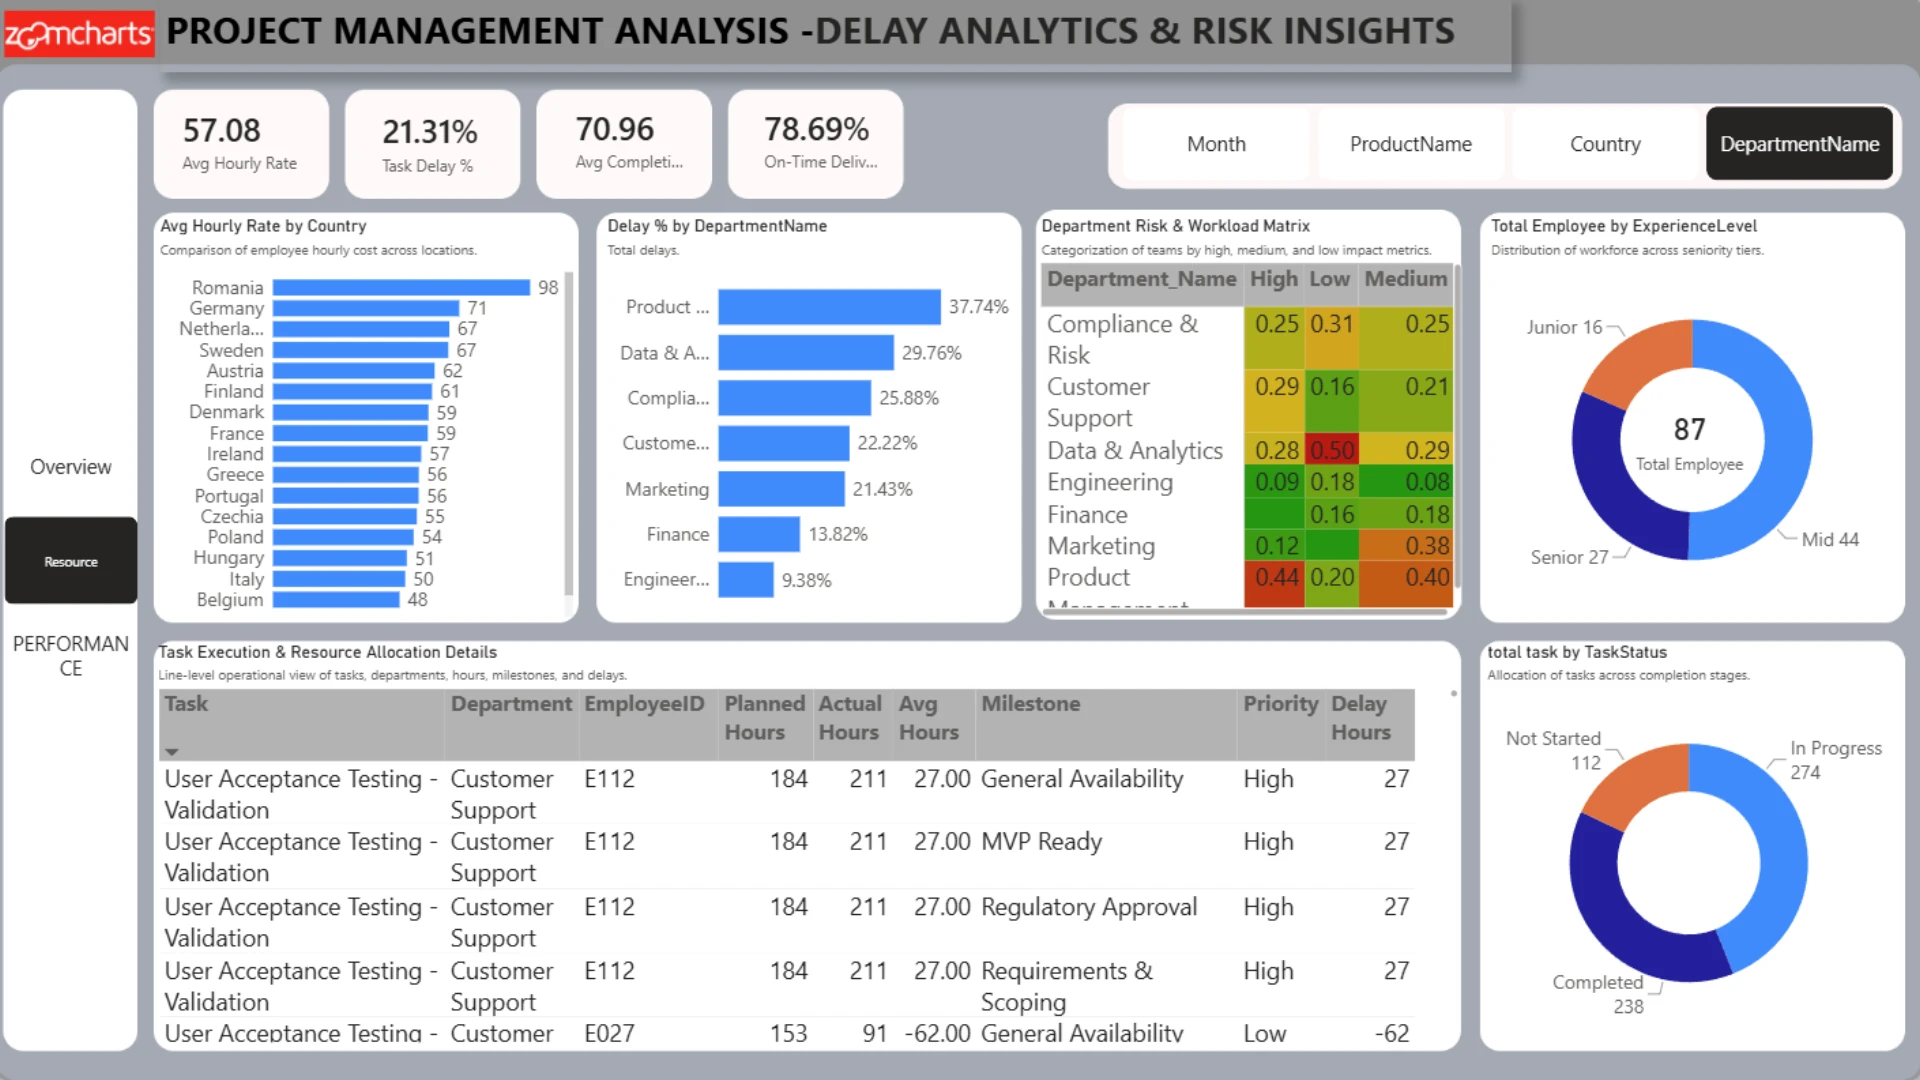
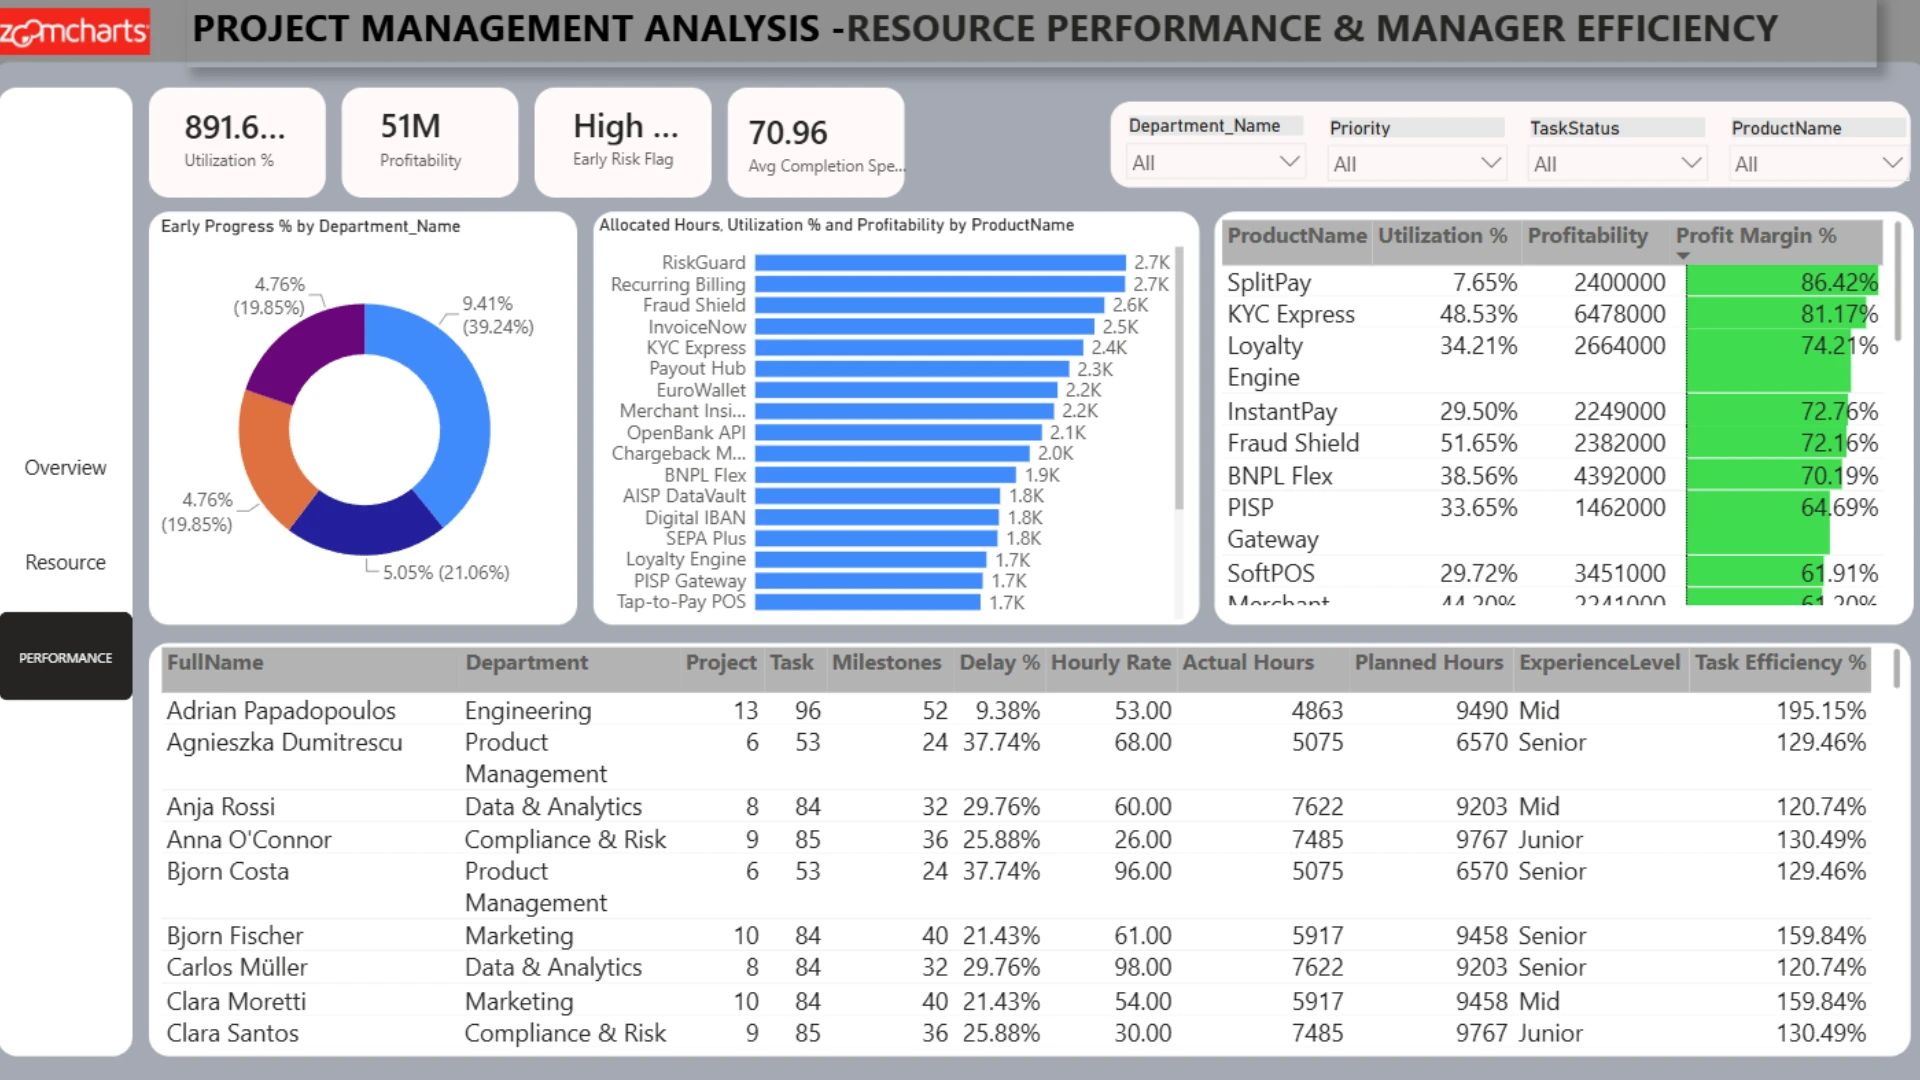
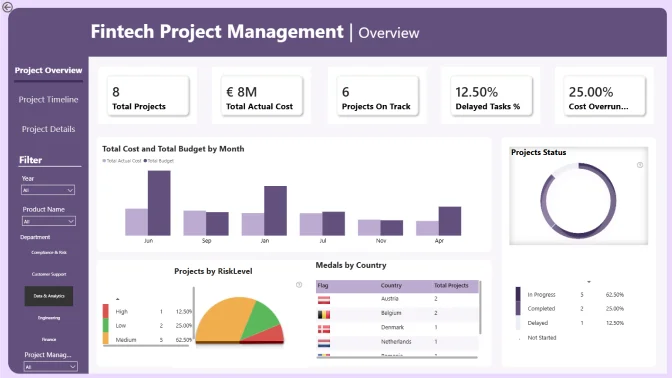
This Power BI report uses the Fintech Project Management dataset and features ZoomCharts Drill Down PRO custom visuals for Power BI. It was submitted to the FP20 Analytics ZoomCharts Data Challenge 32 in November 2025.
Author's Description:
This Power BI project presents a comprehensive data analysis using interactive visualizations to uncover key insights. The report leverages ZoomCharts features to provide dynamic, intuitive interactions, enabling users to explore trends, patterns, and performance metrics effectively. The project includes clear visual storytelling, with charts, tables, and filters designed to highlight actionable insights. This report demonstrates the application of data modeling, analytical thinking, and interactive reporting to facilitate informed decision-making.
ZoomCharts visuals used
4U Report Challenges
Participate in data challenges, build and submit reports to get free template downloads.
Join CommunityMobile view allows you to interact with the report. To Download the template please switch to desktop view.


Was this helpful? Thank you for your feedback!
Sorry about that.
How can we improve it?