1094
Project & Resource Management Power BI Dashboard
Project & Resource Management Power BI Dashboard

More Report pages
Report Author: Rofiat Mosobalaje
1094
Share template with others
Summary
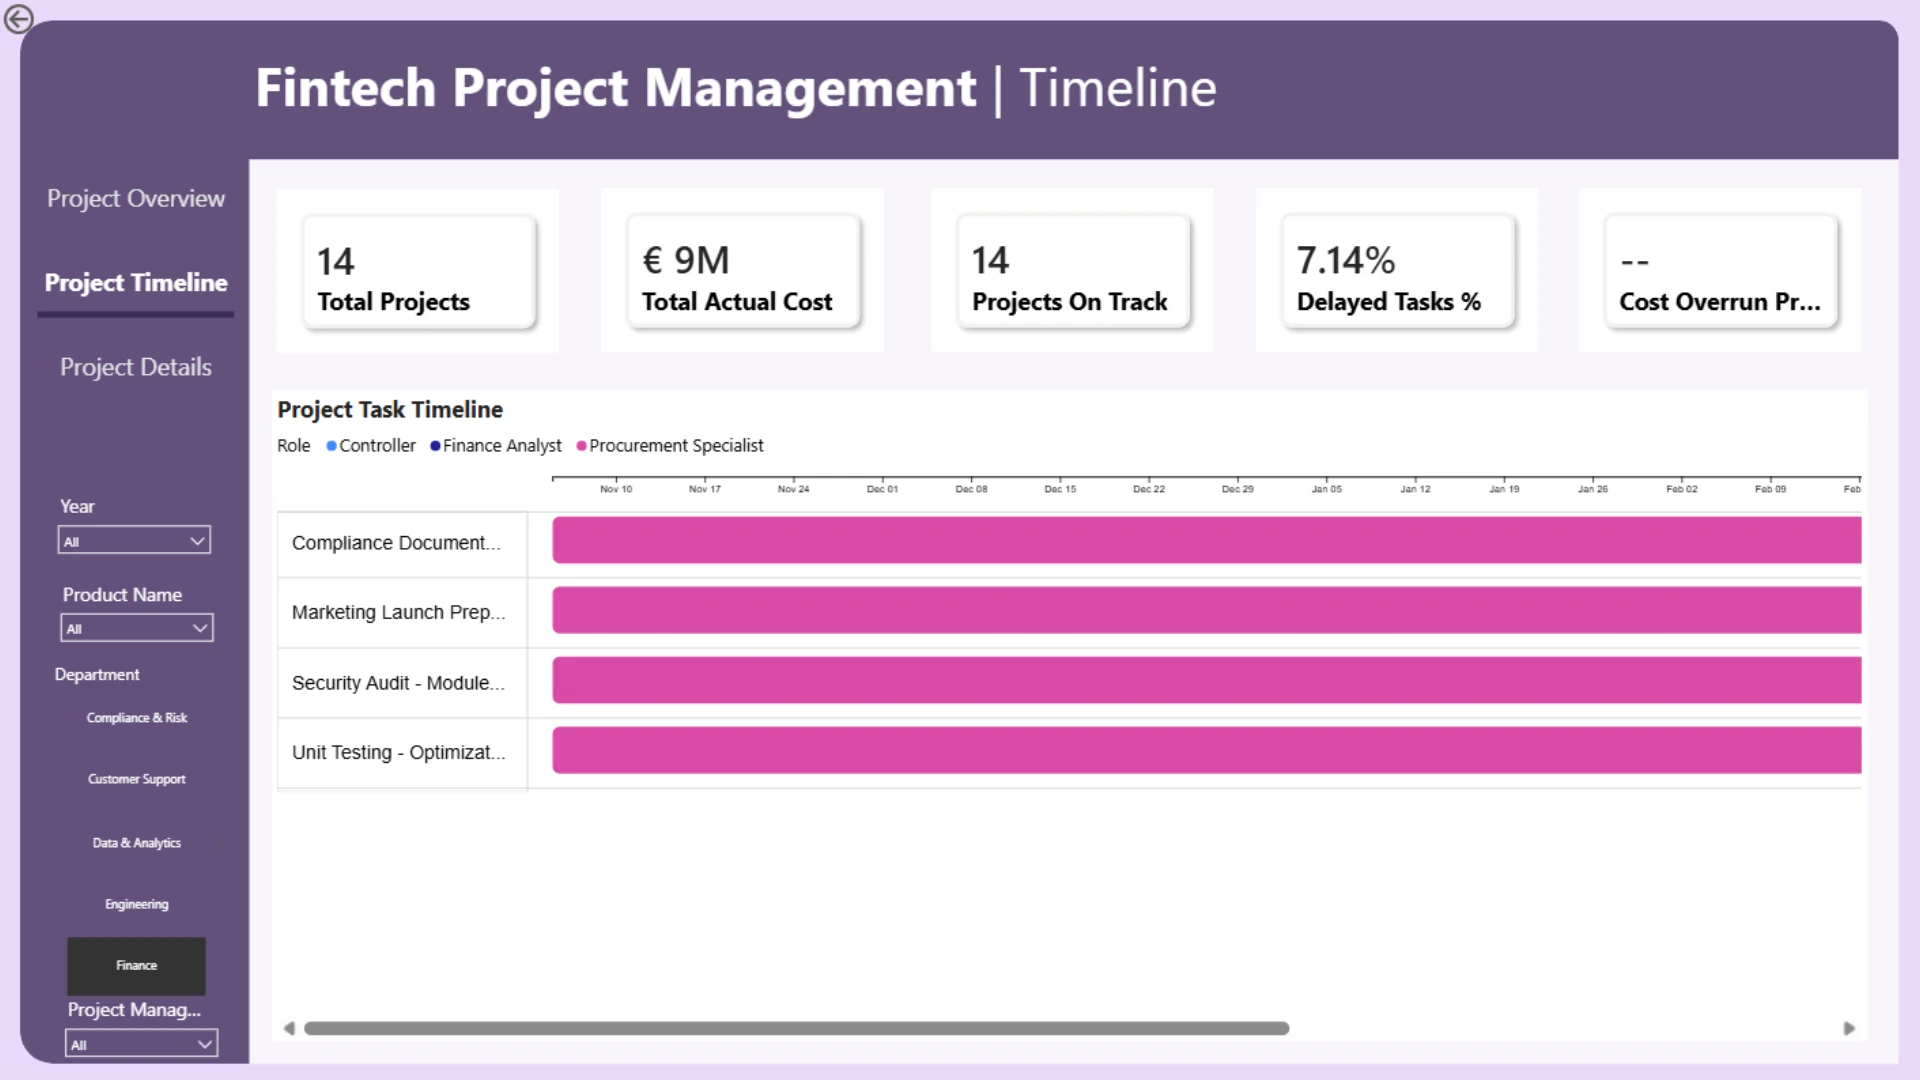
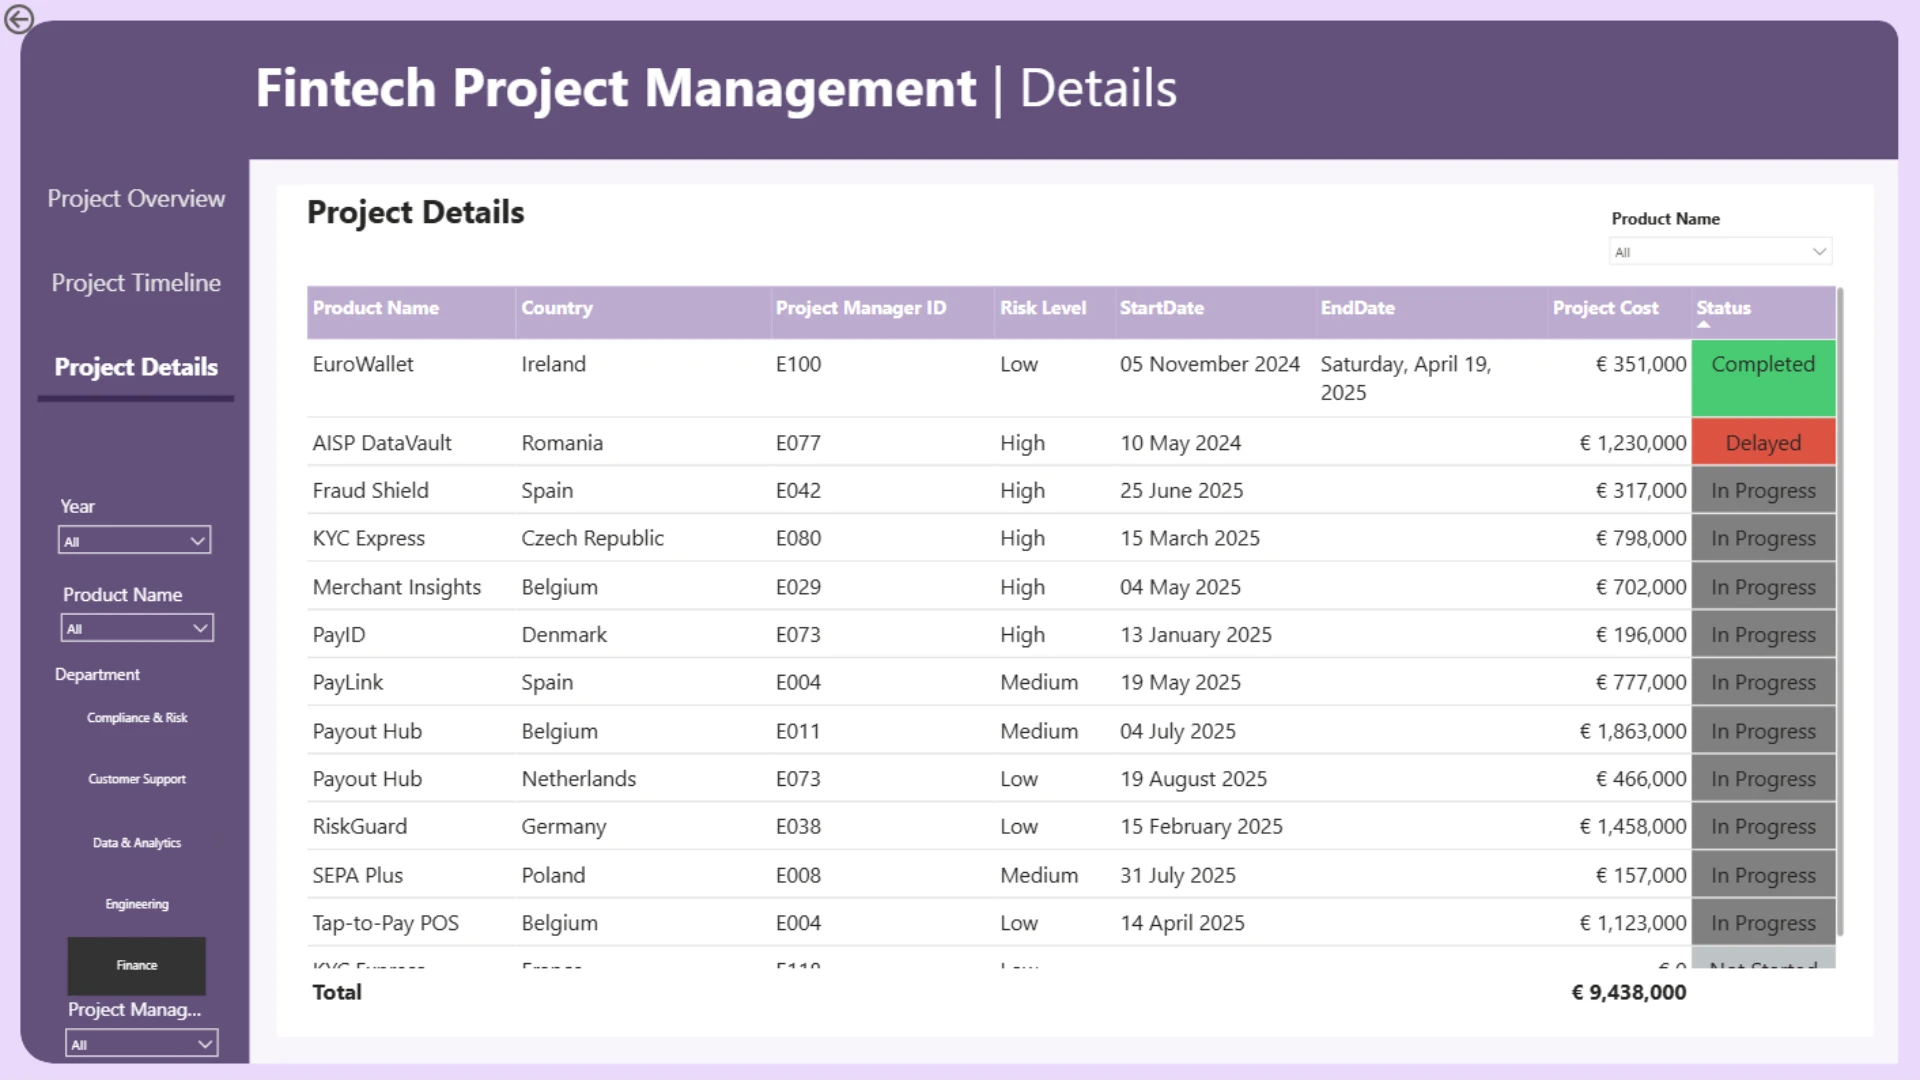
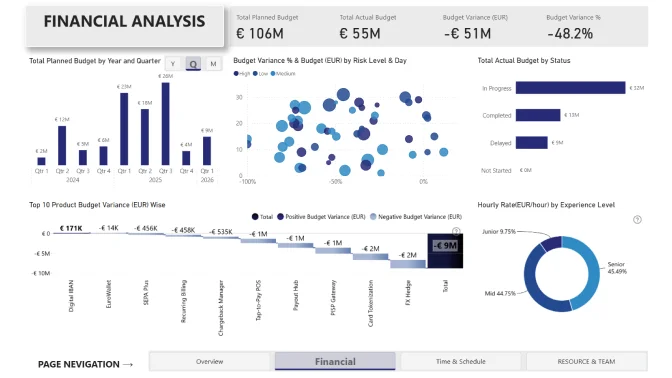
This Power BI fintech project management dashboard example helps users explore project delivery and resource management for payment-solution development. It brings project, task, milestone, employee, and cost data into an interactive reporting experience.
Created by Rofiat Mosobalaje, the report was submitted to the FP20 Analytics ZoomCharts Data Challenge 32 in November 2025.
Key Insights of the Power BI Fintech Project & Resource Management Dashboard
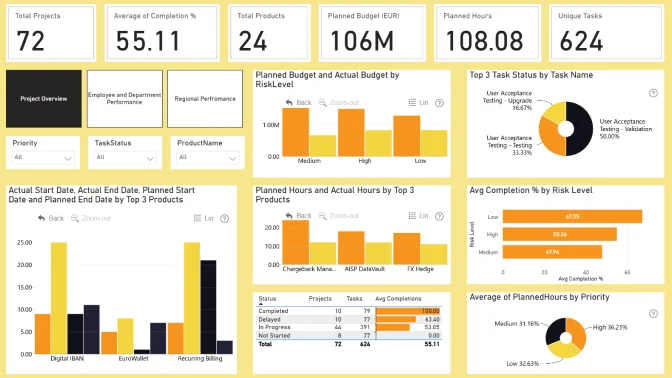
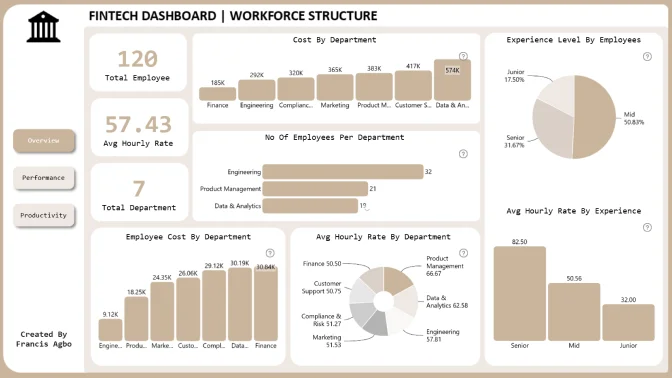
The report is presented across three views that support analysis of fintech projects from delivery and workforce perspectives. Key areas include:
- Project tracking: explore progress across projects, tasks, and milestones
- Time and cost performance: review planned and actual hours and costs
- Resource management: analyze how employees and departments contribute to project delivery
- Workflow status: examine task activity and identify areas that may require attention
Interactive Drill Down Pie PRO and Drill Down Donut PRO visuals make it easier to move from portfolio-level information to more focused project and resource details.
How to Use This Power BI Fintech Project & Resource Management Dashboard
Click active chart elements to filter the report and drill into relevant categories. Move between report views to examine project delivery, task activity, and resource information from different perspectives.
Preview the dashboard online or download the .pbix file to examine its data model, calculations, visual settings, and interactions. Replace the sample data with your own project data to adapt the template in Power BI Desktop.


4U Report Challenges
Participate in data challenges, build and submit reports to get free template downloads.
Join CommunityMobile view allows you to interact with the report. To Download the template please switch to desktop view.
How to use a PBIX template
Preview the interactive report, download the PBIX file, open it in Power BI Desktop, and replace the same data connection with your own dataset.
Preview and download
Explore the report online and download the PBIX template file.
Open in Power BI Desktop
Open the downloaded PBIX file in Power BI Desktop.
Connect your data
Replace the sample data source with your own dataset.
Refresh and adjust
Refresh the model and update fields or visual were needed.
Save and share
Save your report and publish it for your audience.


