2935
Power BI Workforce Demographics & Productivity Dashboard
Power BI Workforce Demographics & Productivity Dashboard
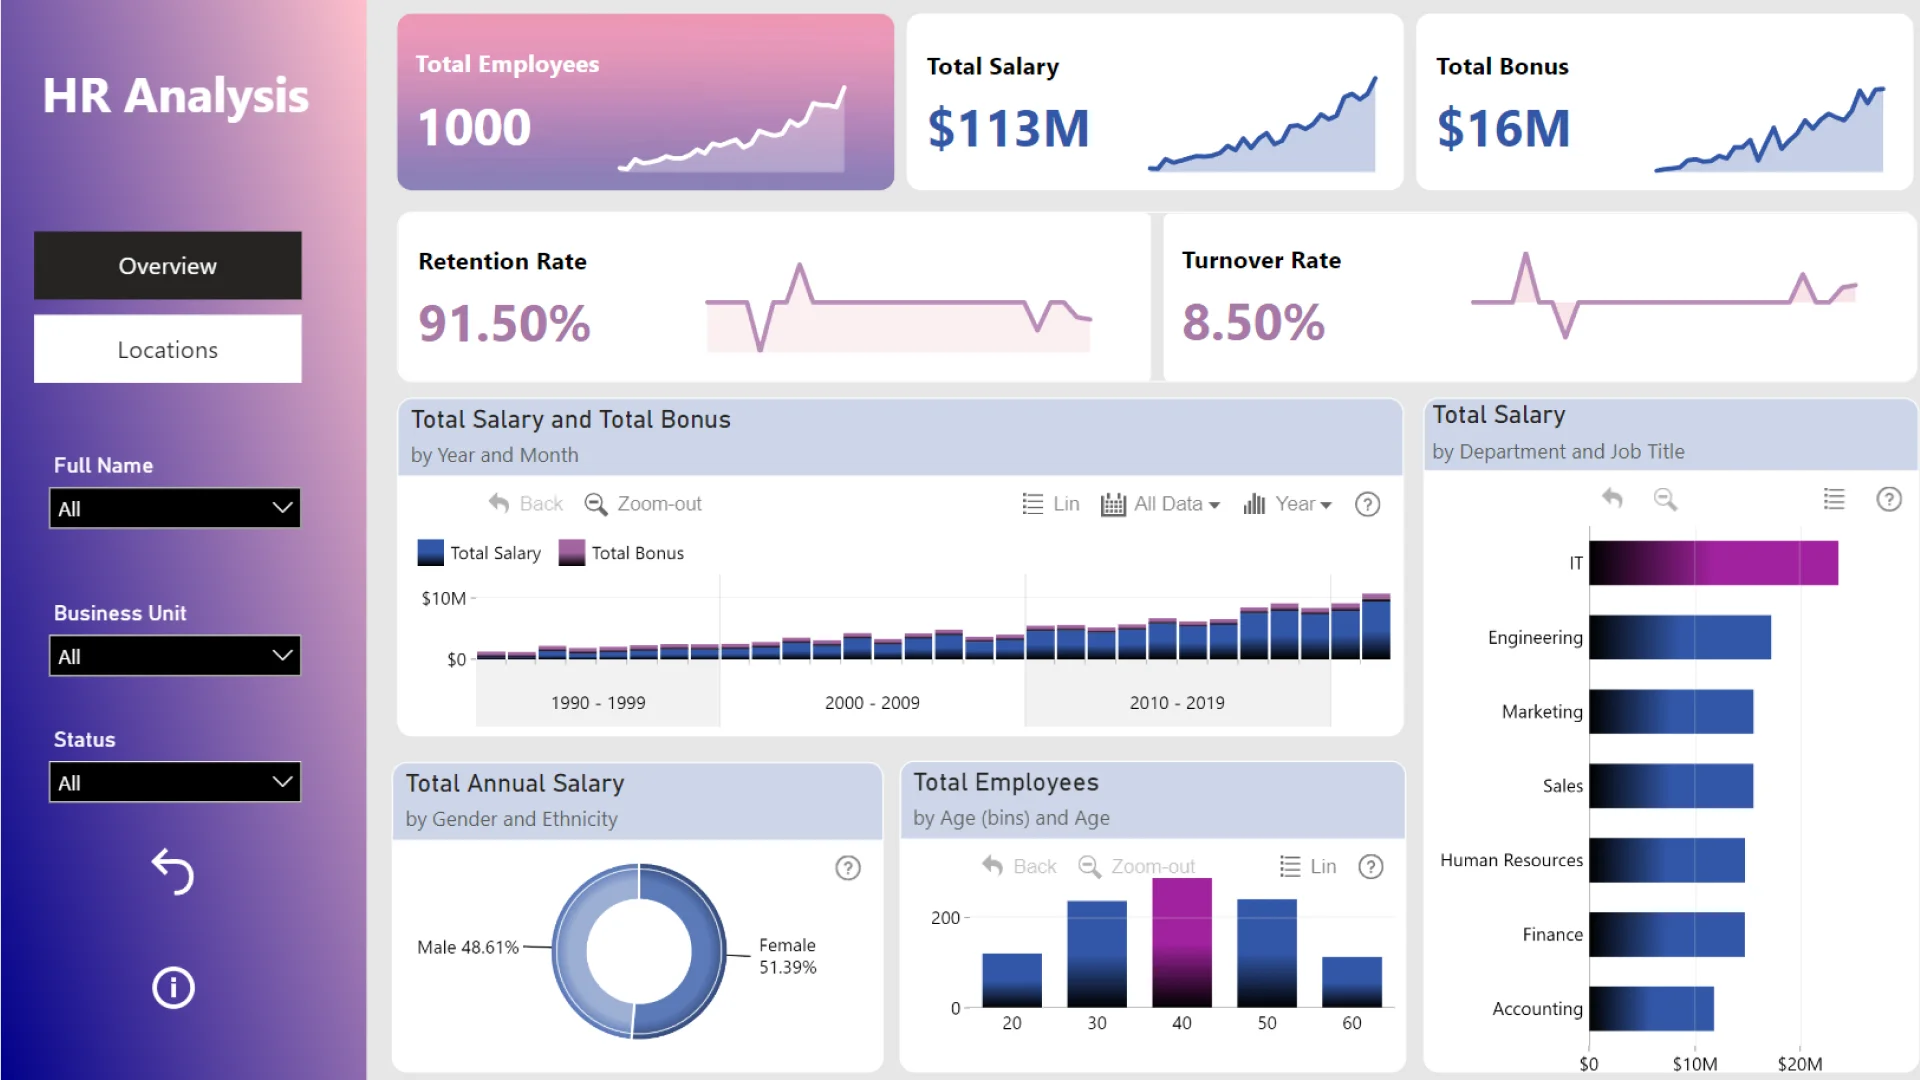
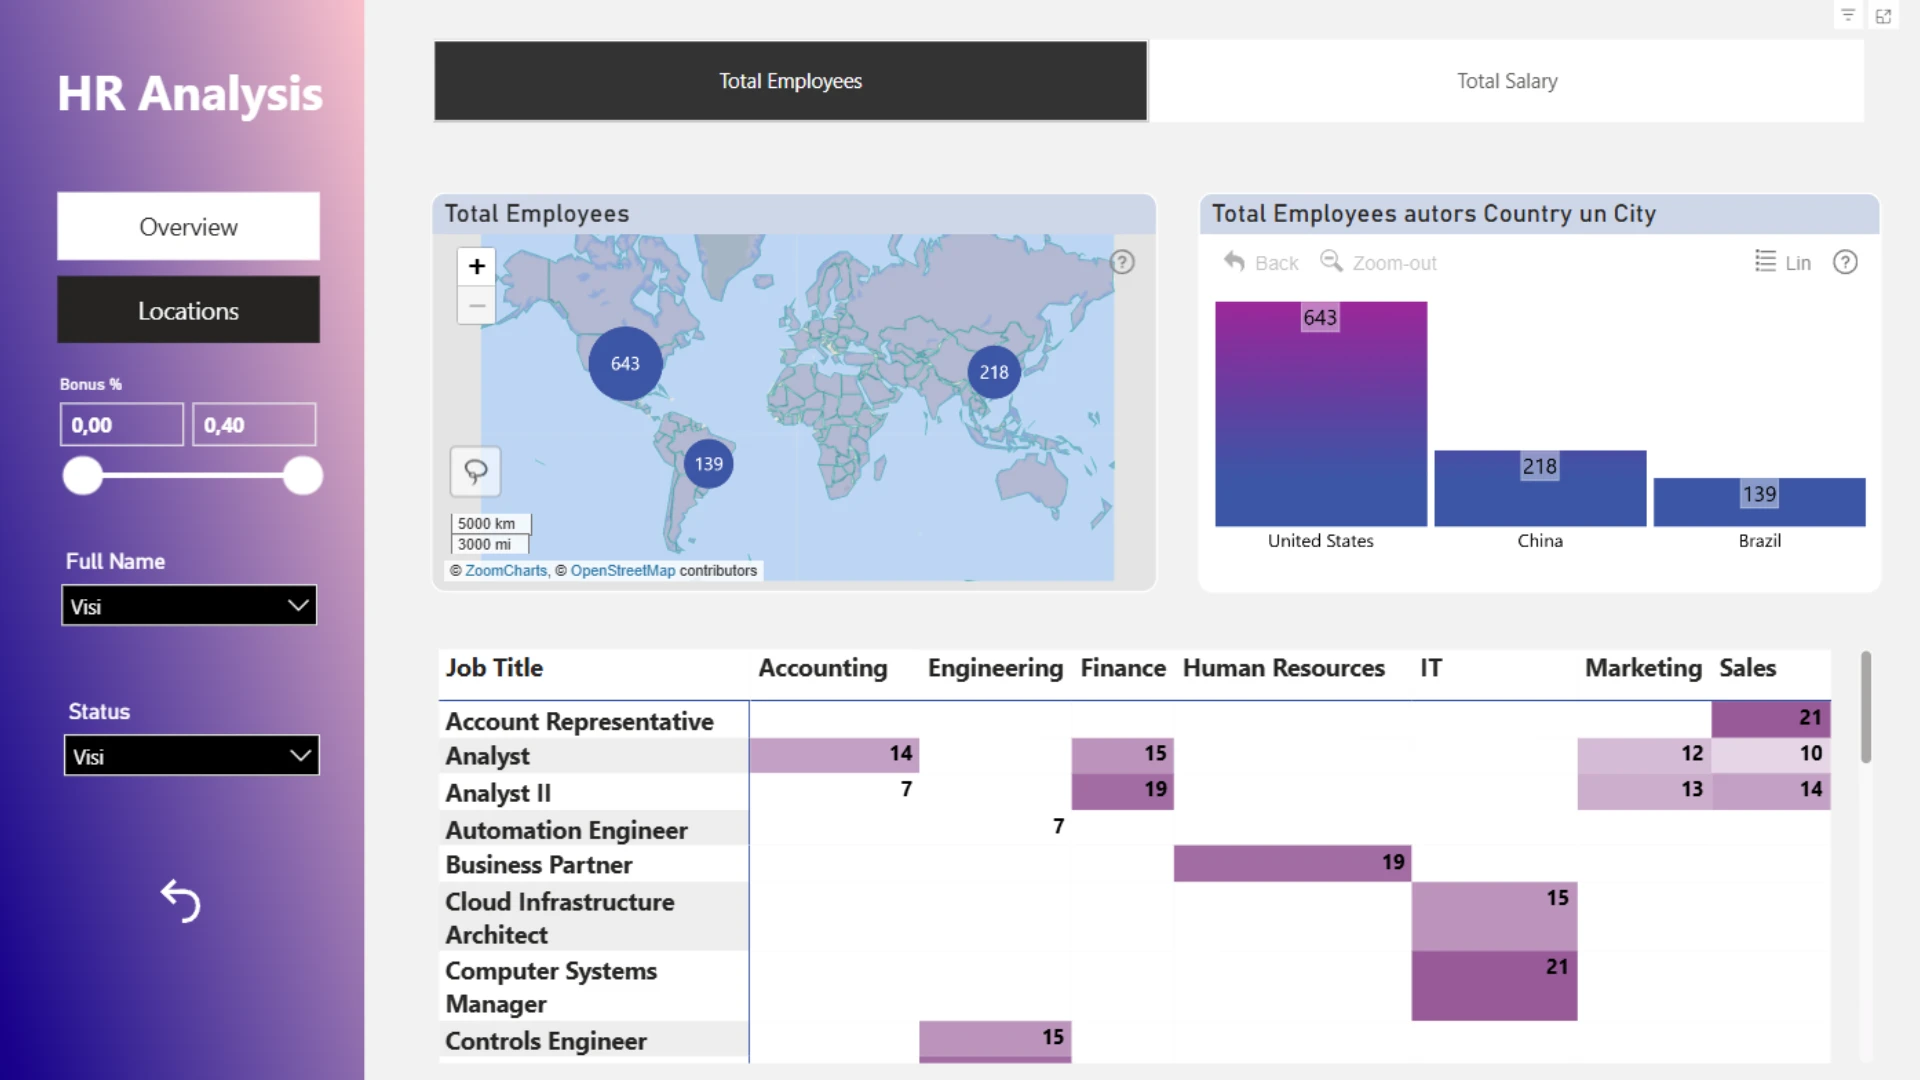
More Report pages
Report Author: Eszter Kovacs
2935
Share template with others
Summary
This Power BI workforce dashboard provides a clear view of employee demographics, retention, compensation, performance, and productivity from 2015 to 2023. It helps HR teams monitor workforce trends, compare employee groups, and identify areas that may require further attention.
The report was created by Eszter Kovacs for the FP20 Analytics ZoomCharts Challenge 15 using the HR Analysis dataset.
Key Insights of the Power BI Workforce Dashboard
The report combines workforce demographics, salary analysis, and employee performance views. Its key insights include:
- Workforce overview: total, active, and resigned employees, retention rate, and average salary
- Employee demographics: active employees by gender and age group
- Salary analysis: salary distribution by education and department, with average salary comparisons across job titles
- Retention trends: changes in active and resigned employee numbers over time, including positions with the highest resignation rates
- Performance and productivity: employee satisfaction, performance scores, training activity, overtime hours, and projects handled
- Workforce planning: promotions, sick leave, and overtime patterns by gender and job title
Interactive Power BI visuals make it easy to compare departments, roles, demographic groups, and reporting periods. These views can help HR teams recognize workforce patterns, investigate retention risks, and support decisions about compensation, training, workload, and employee development.
How to Use This Power BI Workforce Dashboard
Use the year, department, and education-level filters to focus the analysis on specific workforce segments. Click active chart elements to filter related visuals, compare employee groups, and drill down into more detailed time-based data.
Navigate between the workforce demographics, salary, performance, and productivity views to explore the report from different perspectives. Download the .pbix file to review its settings, formulas, and calculations or adapt the dashboard to your own HR data.
ZoomCharts visuals used





4U Report Challenges
Participate in data challenges, build and submit reports to get free template downloads.
Join CommunityMobile view allows you to interact with the report. To Download the template please switch to desktop view.
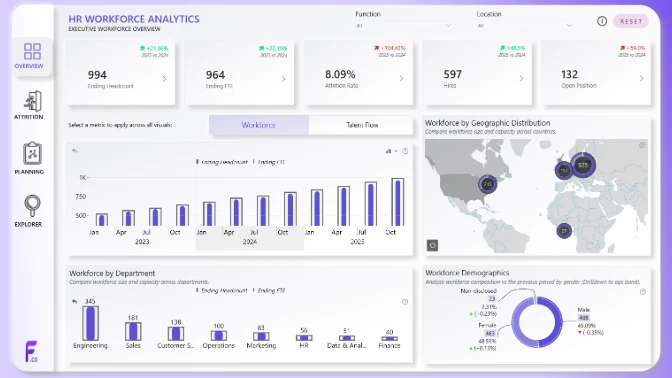
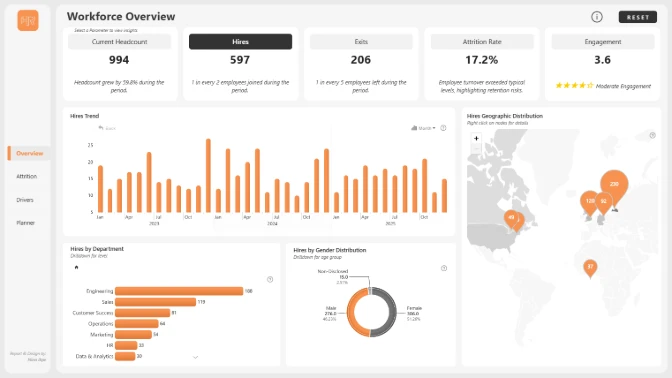
How to use a PBIX template
Preview the interactive report, download the PBIX file, open it in Power BI Desktop, and replace the same data connection with your own dataset.
Preview and download
Explore the report online and download the PBIX template file.
Open in Power BI Desktop
Open the downloaded PBIX file in Power BI Desktop.
Connect your data
Replace the sample data source with your own dataset.
Refresh and adjust
Refresh the model and update fields or visual were needed.
Save and share
Save your report and publish it for your audience.


