218
Power BI Online Store Performance Dashboard
Power BI Online Store Performance Dashboard
Report Author: Neha Agarwal
218
Share template with others
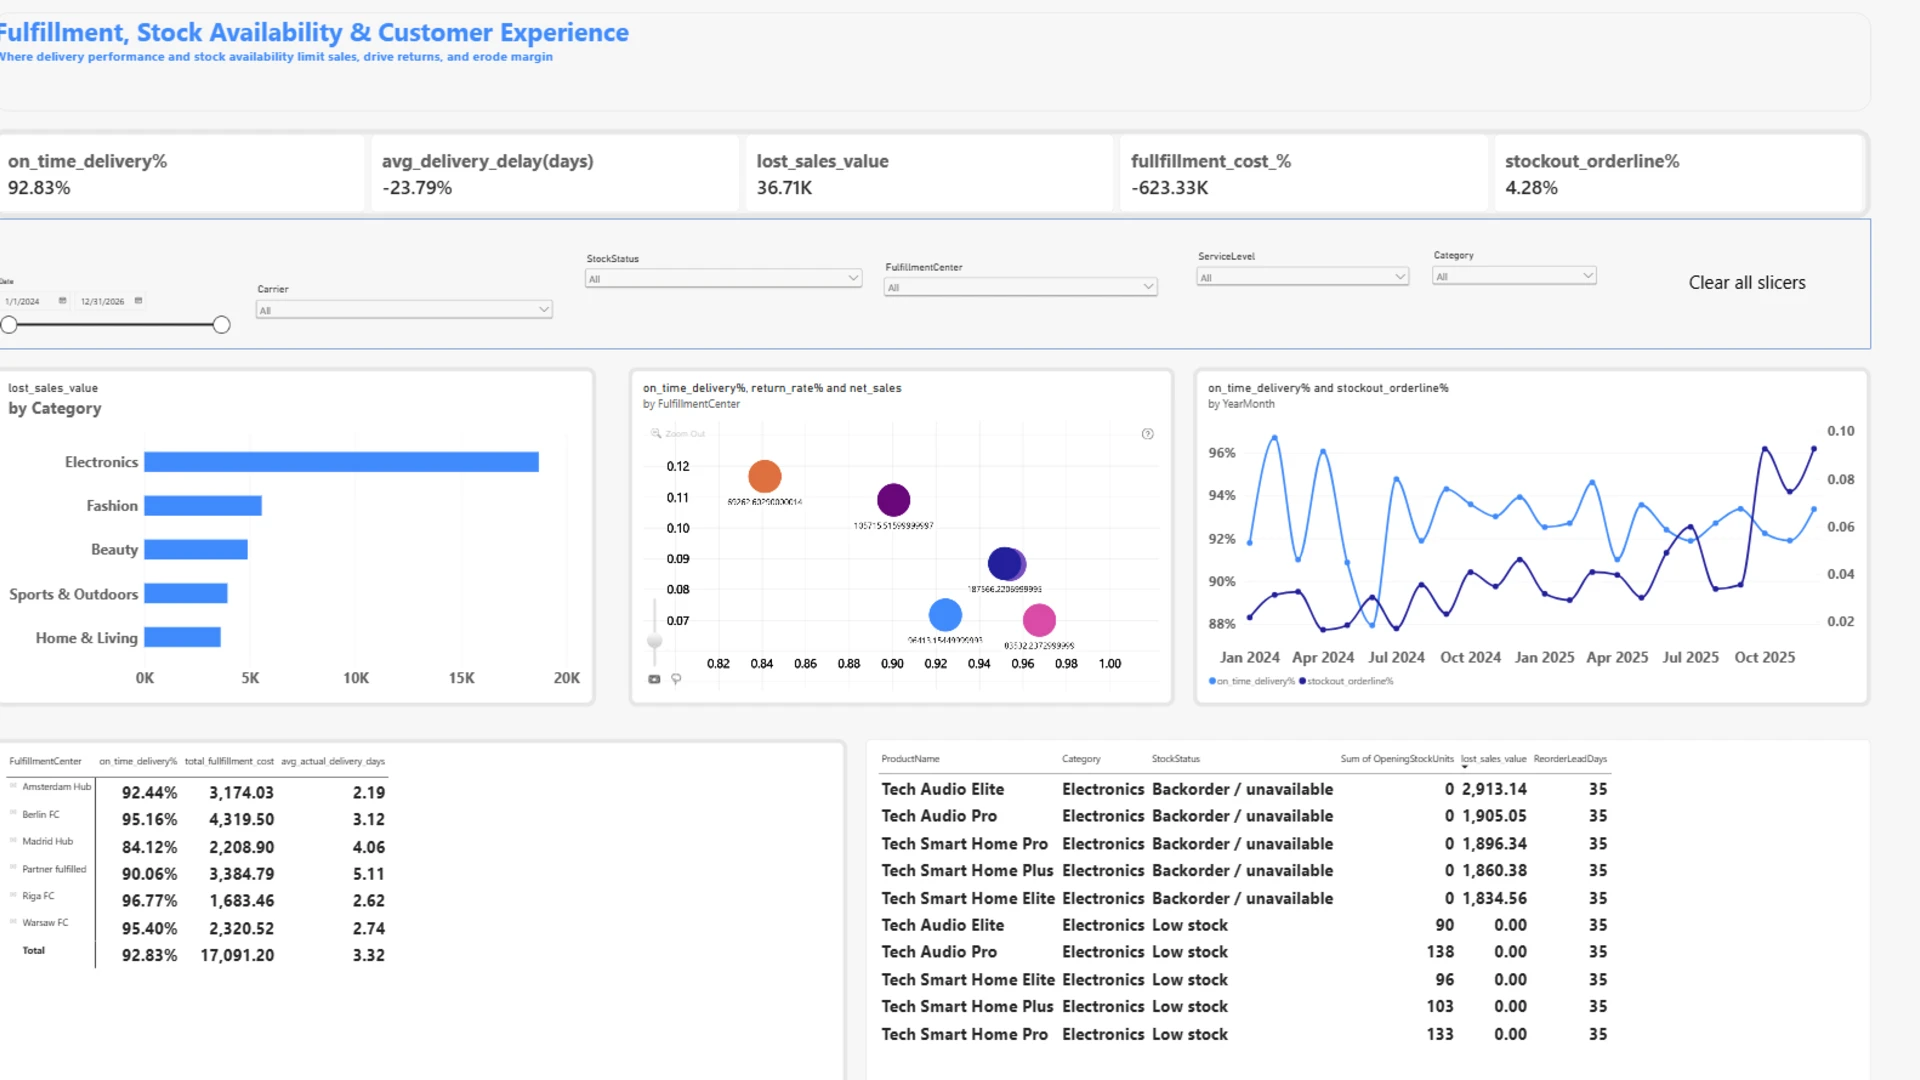
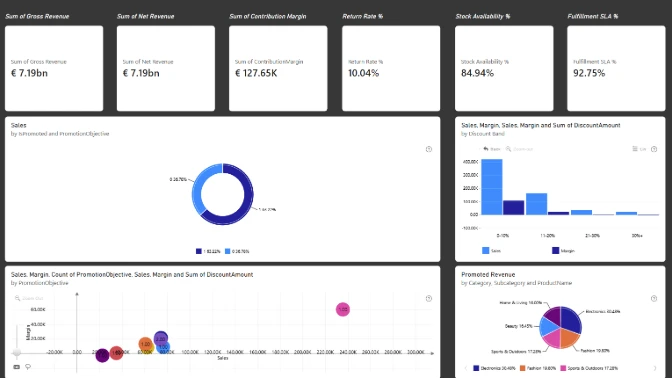
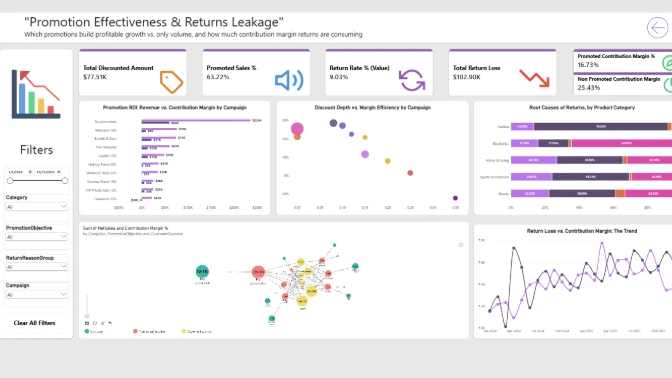
Use this Power BI example to explore online store performance dashboard with European e-commerce data. Compare relevant sales, margin, customer, return, promotion, fulfillment, market, and inventory perspectives.
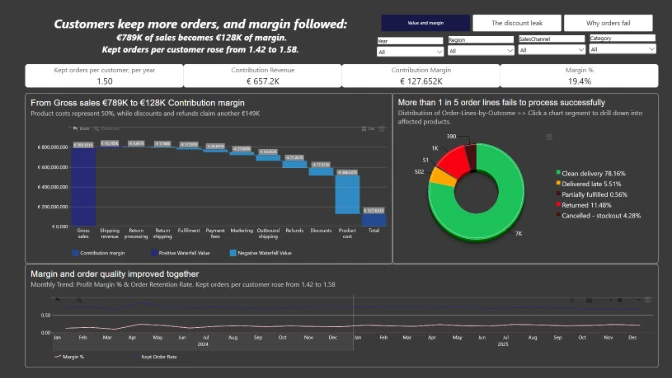
The report brings together revenue, discounts, refunds, operating costs, and contribution margin to show where profit is being generated and where it is being lost.
Interactive visuals help users identify the biggest sources of margin leakage, compare key cost drivers, and understand how different factors affect overall profitability. The dashboard is designed to support a clearer view of business performance beyond sales alone, with a stronger focus on contribution margin and the areas that have the greatest impact on profit.


4U Report Challenges
Participate in data challenges, build and submit reports to get free template downloads.
Join CommunityMobile view allows you to interact with the report. To Download the template please switch to desktop view.
How to use a PBIX template
Preview the interactive report, download the PBIX file, open it in Power BI Desktop, and replace the same data connection with your own dataset.
Preview and download
Explore the report online and download the PBIX template file.
Open in Power BI Desktop
Open the downloaded PBIX file in Power BI Desktop.
Connect your data
Replace the sample data source with your own dataset.
Refresh and adjust
Refresh the model and update fields or visual were needed.
Save and share
Save your report and publish it for your audience.


