202
Ecommerce Profitability and Fulfillment Dashboard
Ecommerce Profitability and Fulfillment Dashboard
More Report pages
Report Author: Nkechi Alexander
202
Share template with others
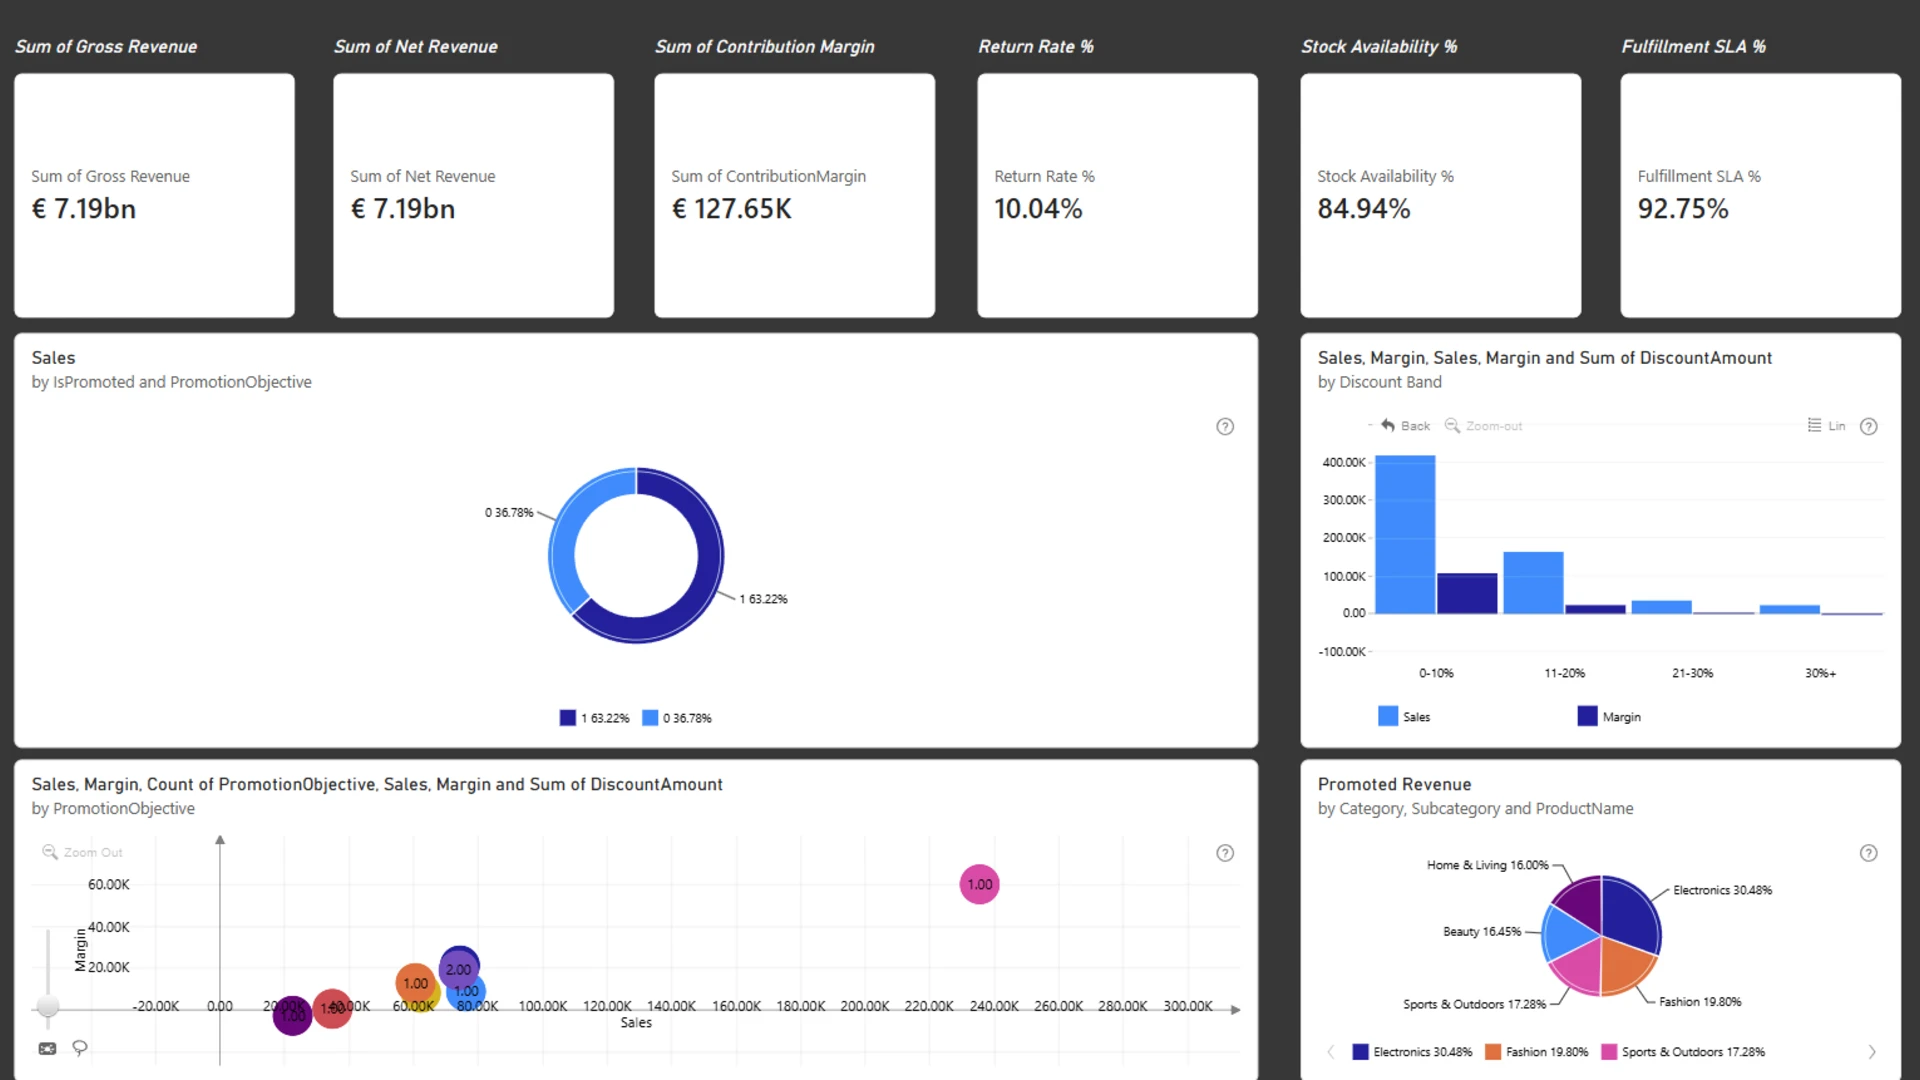
This Power BI challenge is based on a European e-commerce dataset with more than 9,000 order-line records from 2024–2025. The data connects sales transactions with products, customers, geography, promotions, sales channels, fulfilment providers, returns, and customer lifecycle stages.
The dataset is designed to go beyond revenue and show the full profitability journey, from gross sales to contribution margin. It includes discounts, refunds and returns, shipping revenue, product costs, fulfilment costs, return costs, payment fees, marketing costs, stockout-related lost sales, and final contribution margin.
The main objective is to build a Power BI report that explains not only what was sold, but what was actually profitable.
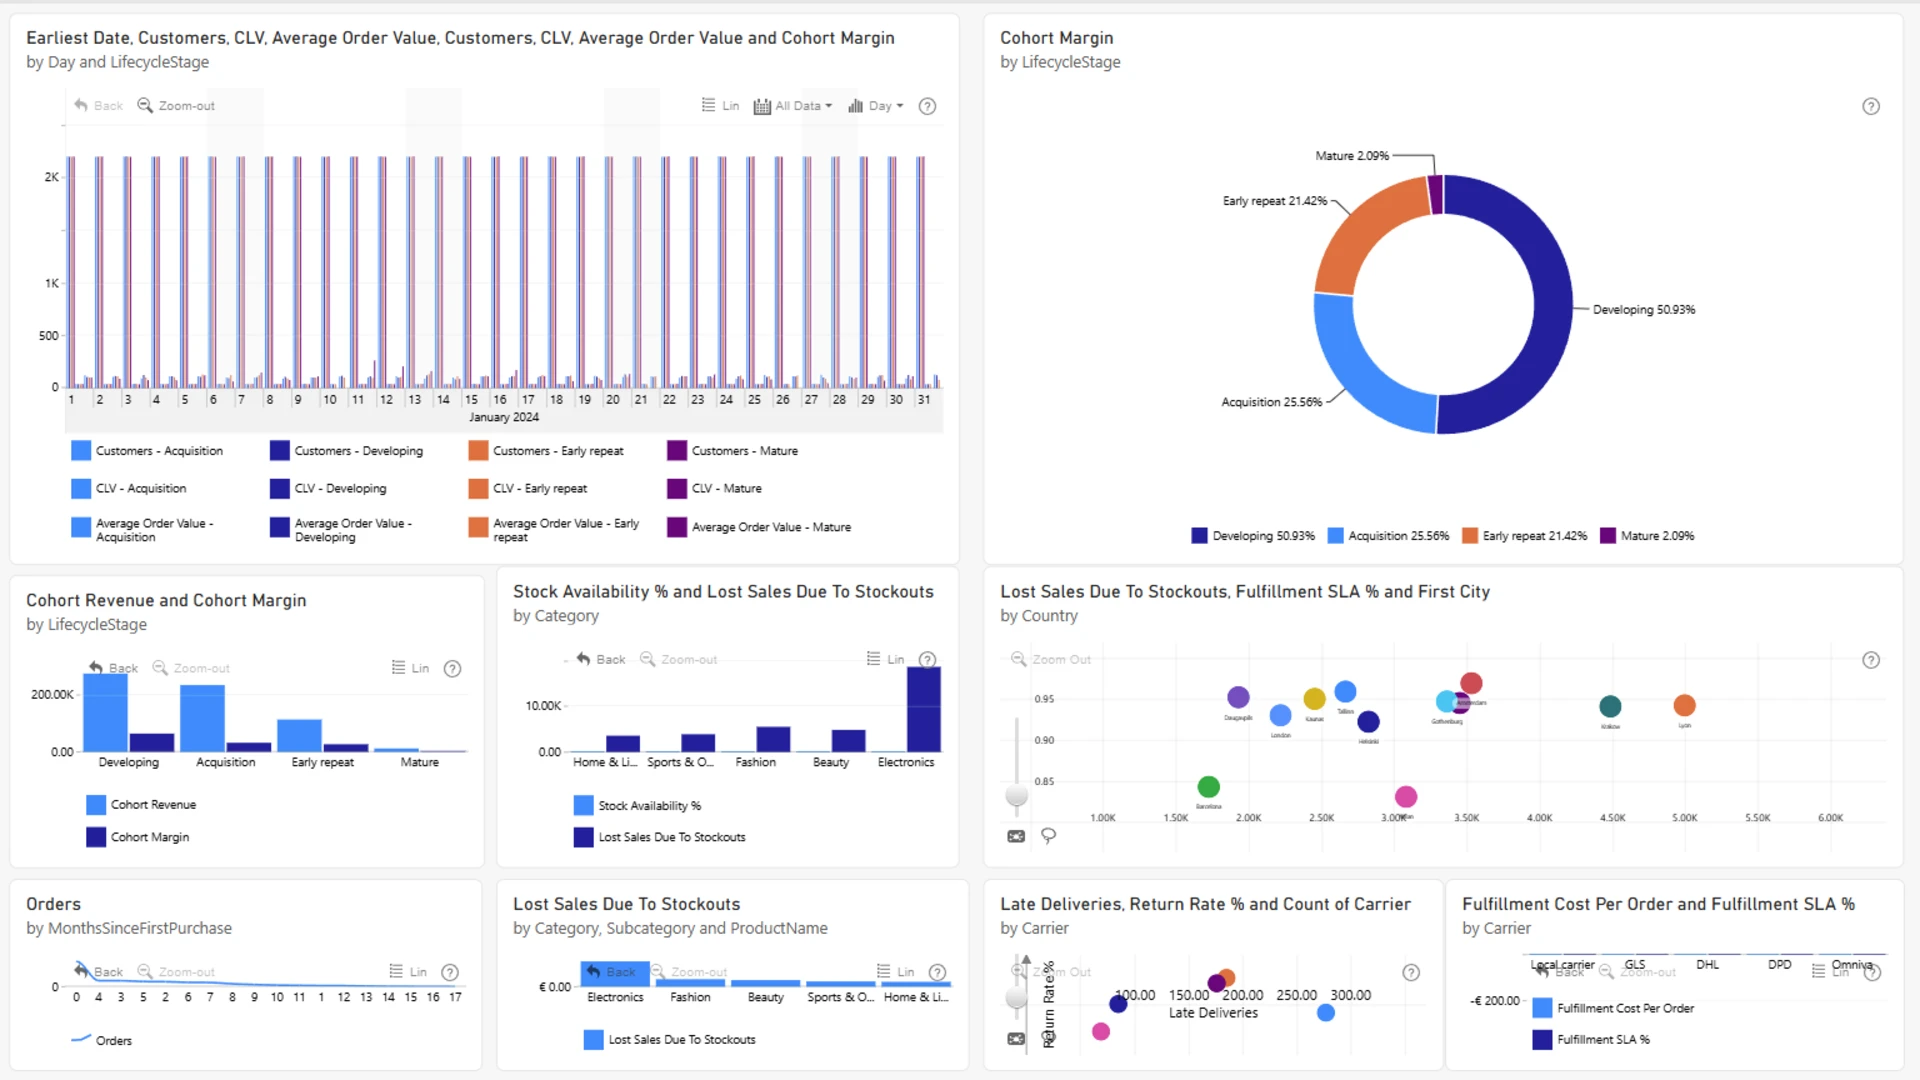
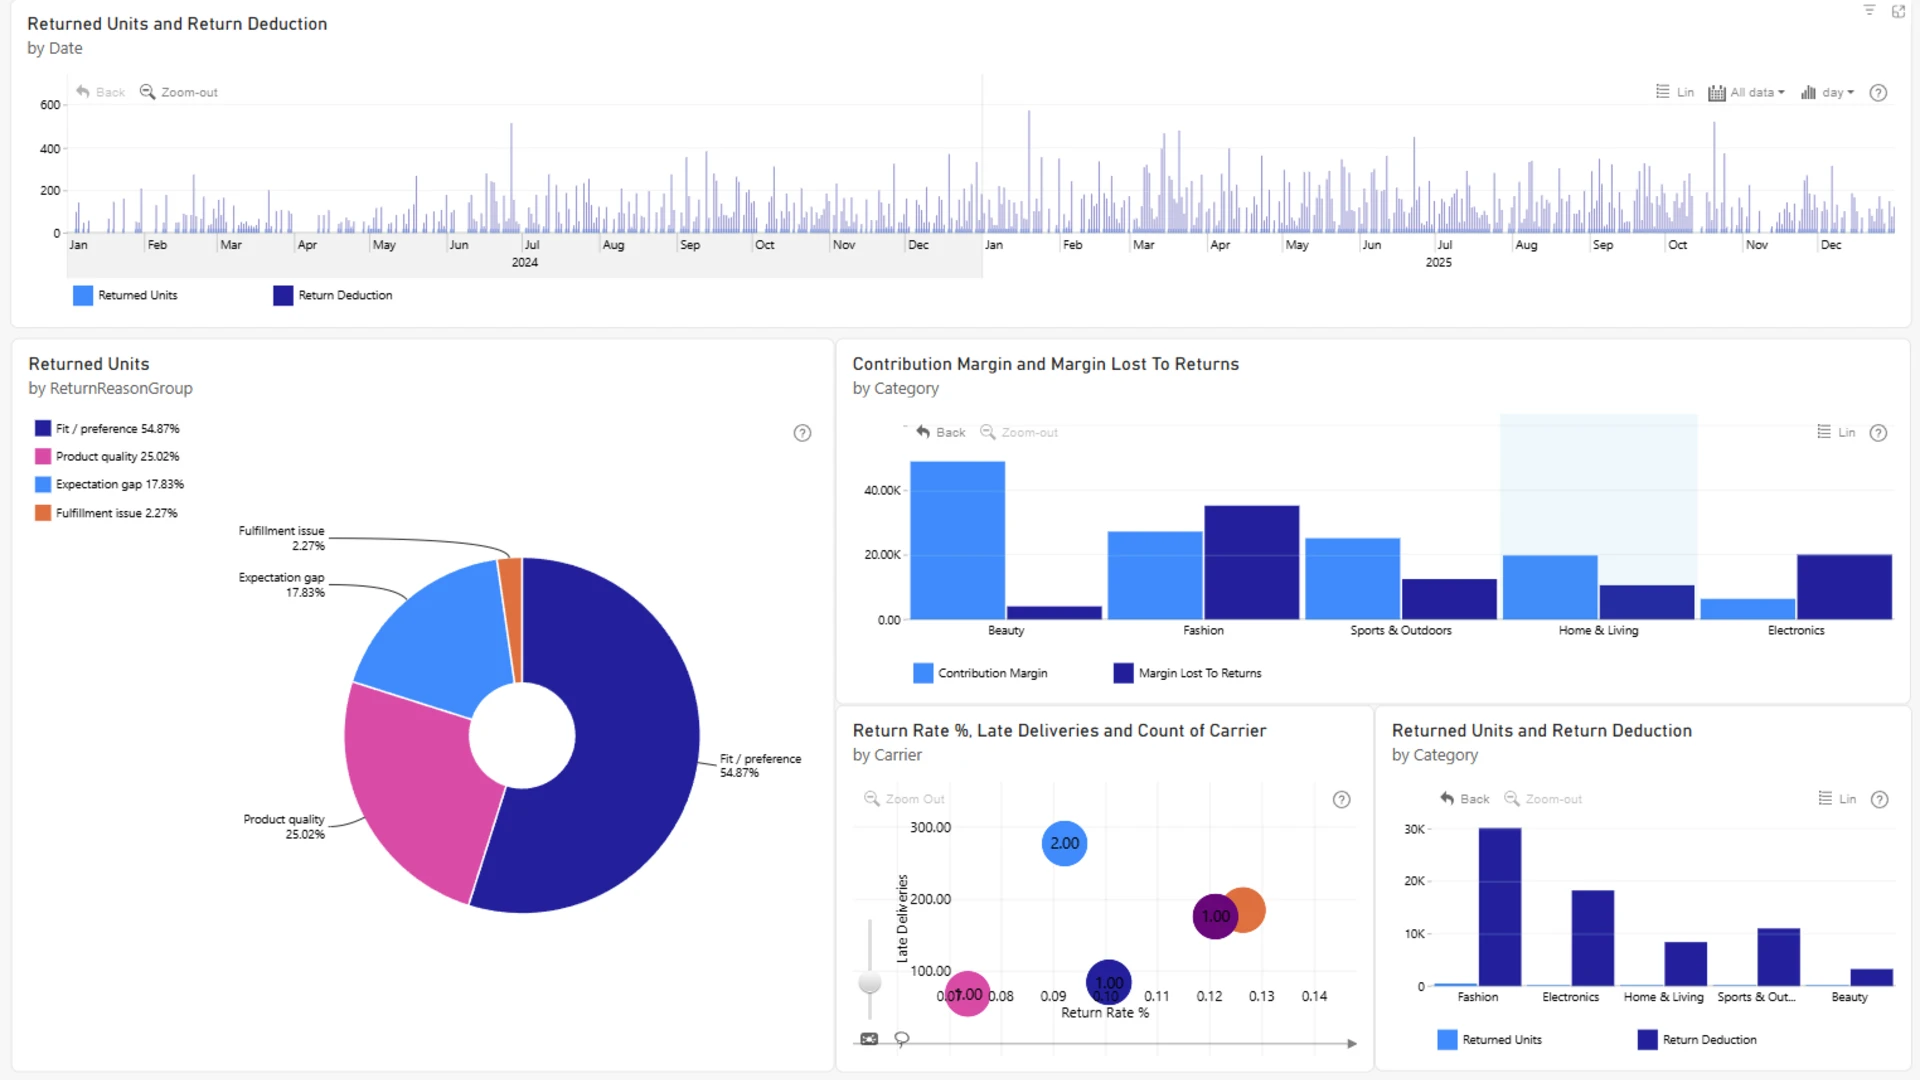
The report should help users identify the most profitable products, categories, customers, and channels, while also showing where margin is being lost through discounting, returns, fulfilment costs, and stock shortages. It should also make it possible to evaluate whether promotions are generating real profit, assess delivery and fulfilment performance, analyse customer cohorts, and identify opportunities for more profitable growth.
A strong report can follow the profitability story from several angles: starting with an executive overview, then moving into sales versus contribution margin, promotions, returns, customer behaviour, and finally inventory and fulfilment performance.
At the centre of the analysis is one simple business question: Where does profit come from, where is it being lost, and what can be improved?
Overall, the challenge is about turning e-commerce data into a clear profitability story that helps management focus on growing profit, not just sales.
ZoomCharts visuals used







4U Report Challenges
Participate in data challenges, build and submit reports to get free template downloads.
Join CommunityMobile view allows you to interact with the report. To Download the template please switch to desktop view.



How to use a PBIX template
Preview the interactive report, download the PBIX file, open it in Power BI Desktop, and replace the same data connection with your own dataset.
Preview and download
Explore the report online and download the PBIX template file.
Open in Power BI Desktop
Open the downloaded PBIX file in Power BI Desktop.
Connect your data
Replace the sample data source with your own dataset.
Refresh and adjust
Refresh the model and update fields or visual were needed.
Save and share
Save your report and publish it for your audience.


