875
Executive Budget KPI Performance Power BI Dashboard
Executive Budget KPI Performance Power BI Dashboard
More Report pages
Report Author: Abubakar Iwan
875
Share template with others
Summary
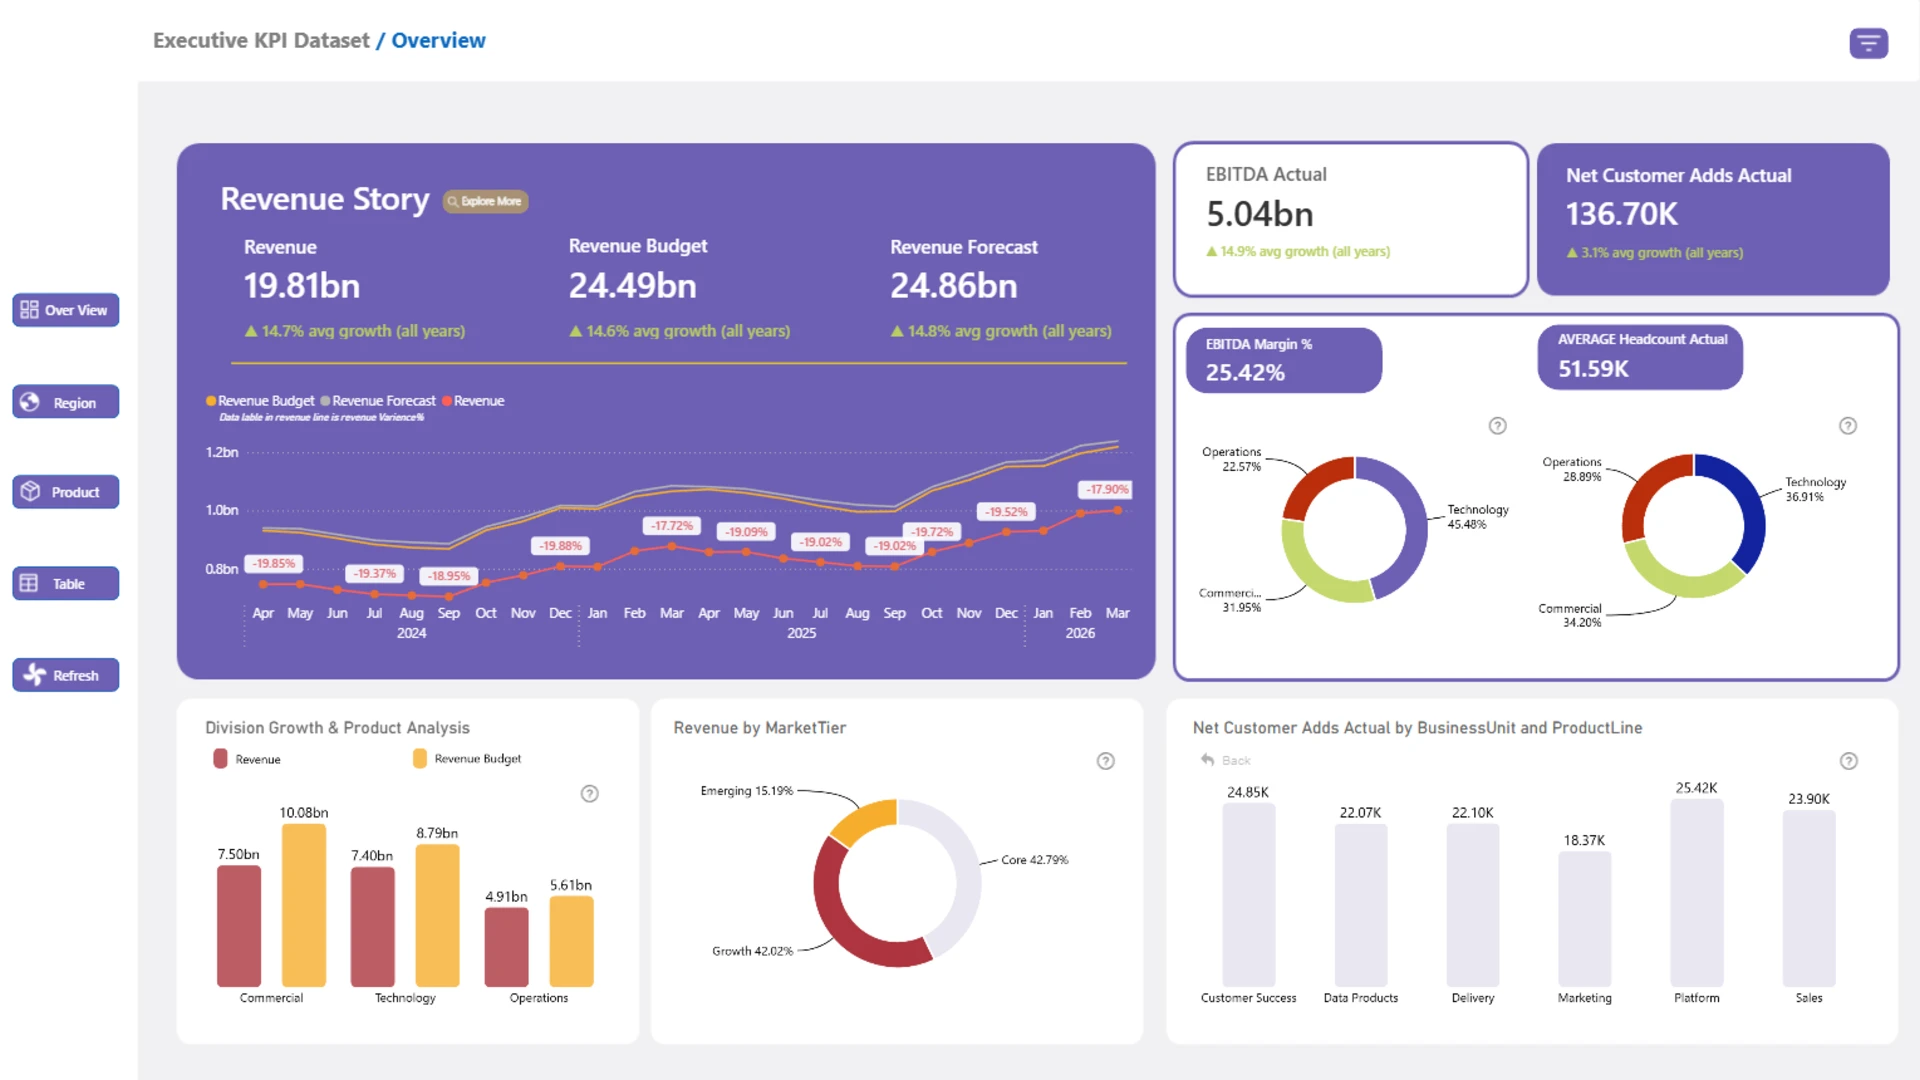
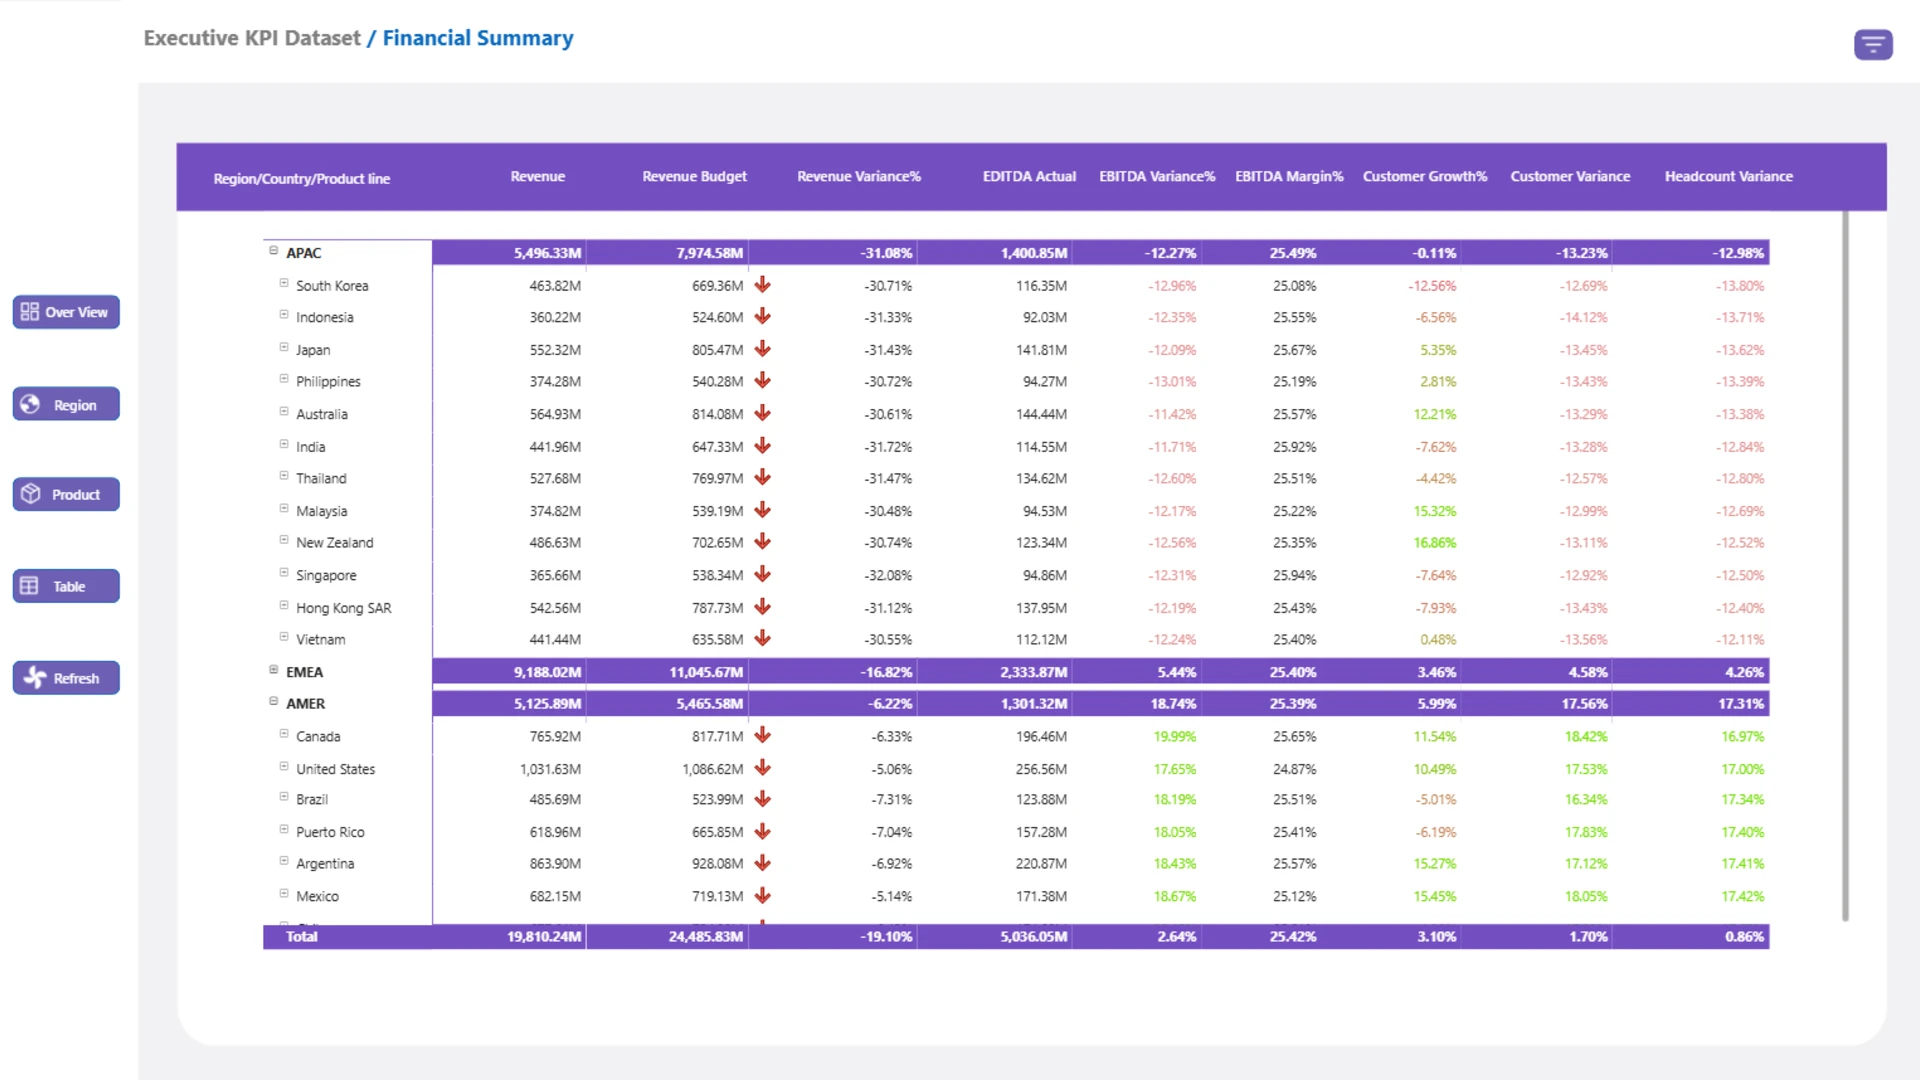
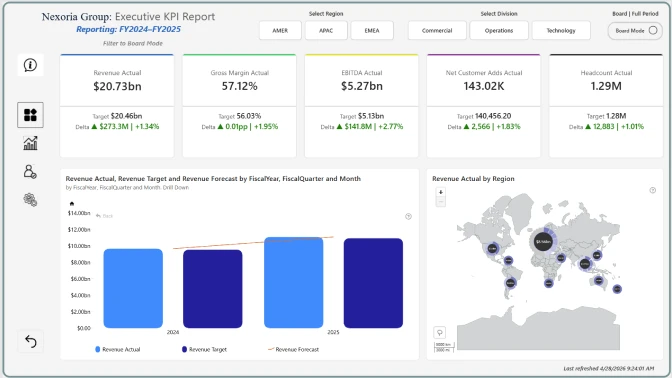
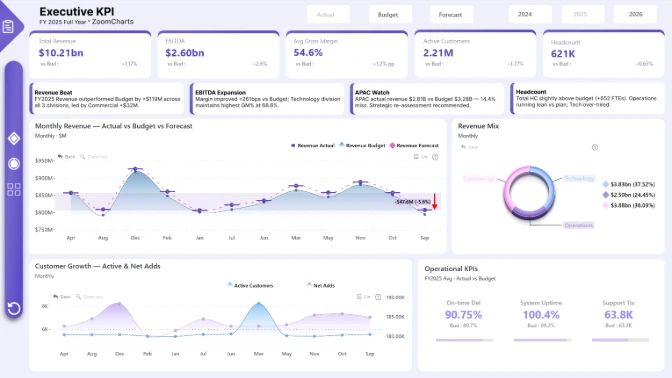
This Power BI executive KPI dashboard helps business leaders compare actual, budget, and forecast performance across Revenue, EBITDA, Margin, Headcount, and Customer Growth.
Created by Abubakar Iwan, the report combines high-level KPI monitoring with organizational drill-down and regional analysis, making it easier to identify performance gaps and examine the results behind each headline metric.
Key Insights of the Power BI Executive KPI & Budget Performance Dashboard
The report presents several perspectives on financial and organizational performance. Its main areas of analysis include:
- Revenue performance: compare actual revenue with budget and forecast values
- Profitability: monitor EBITDA and Margin performance against business expectations
- Workforce capacity: review Headcount alongside other executive KPIs
- Customer Growth: track customer performance against planned and forecast results
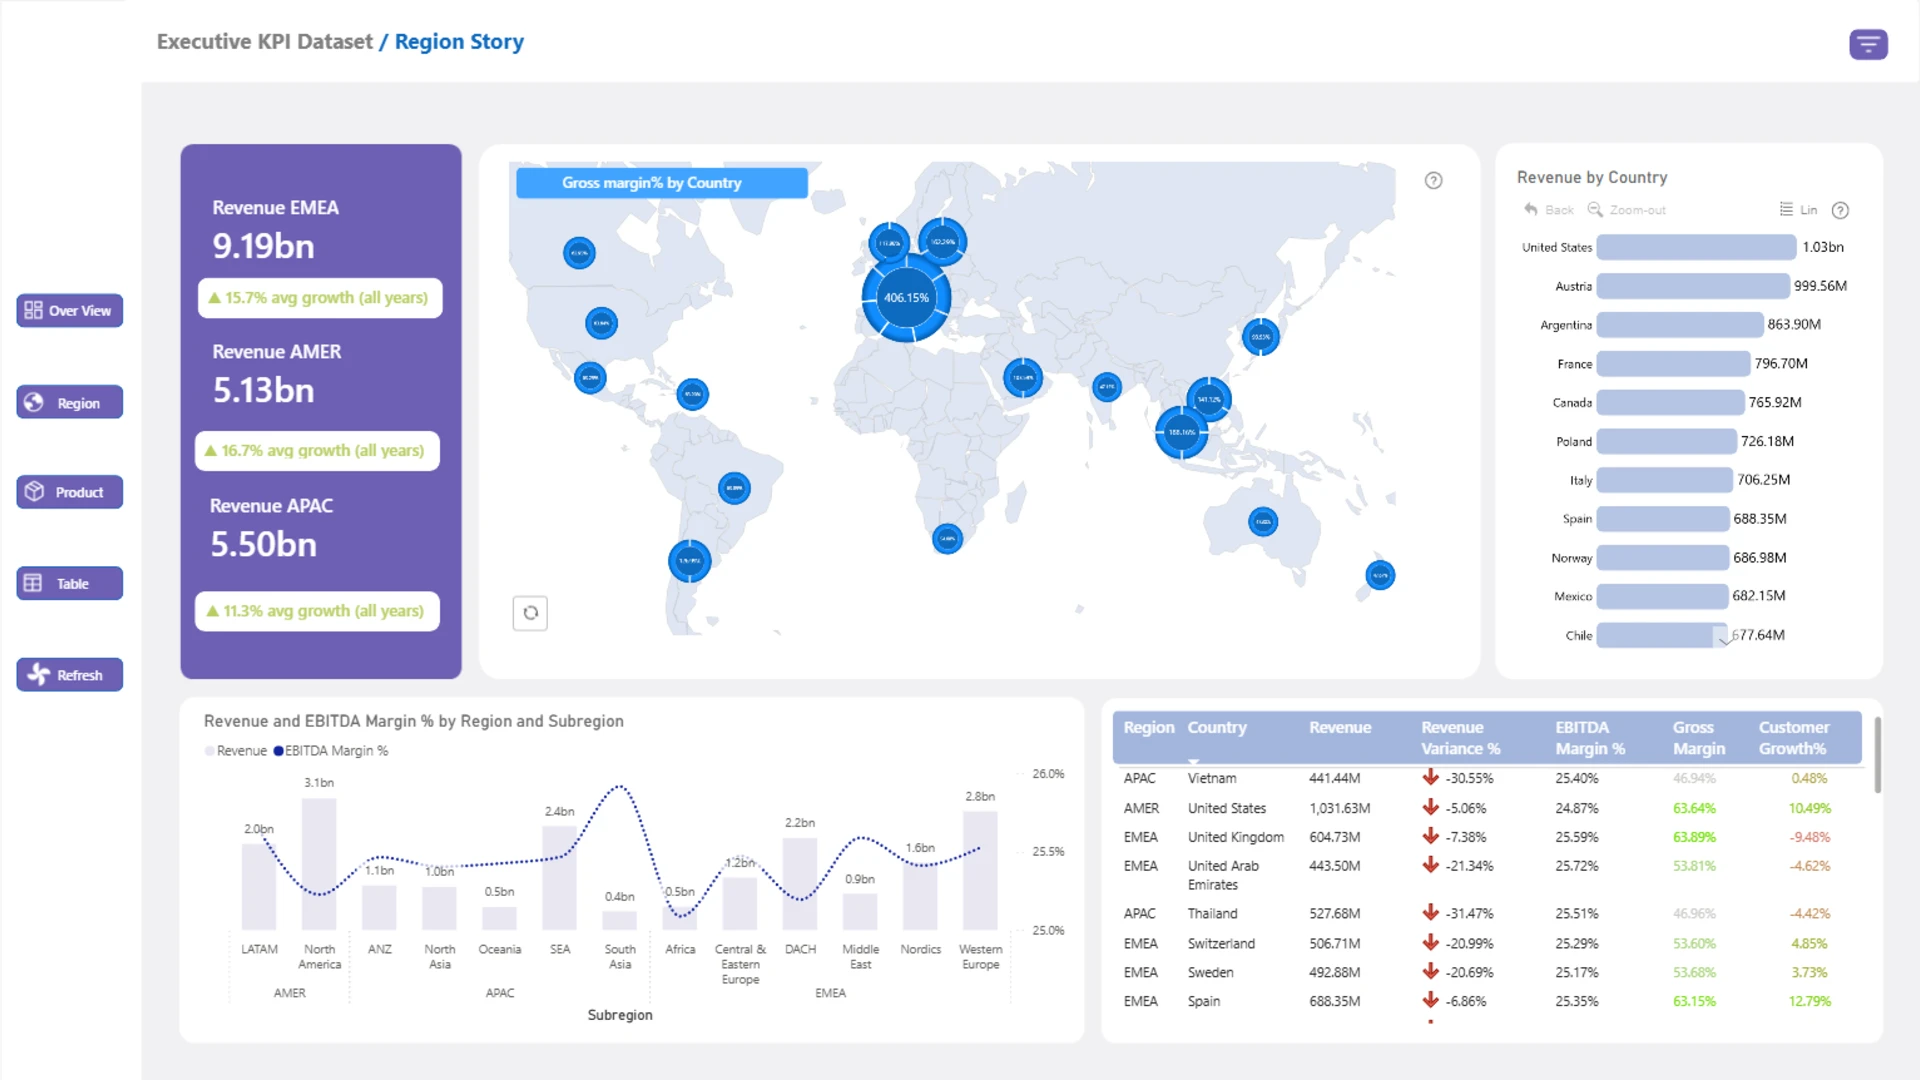
- Regional performance: compare results geographically and investigate differences between regions
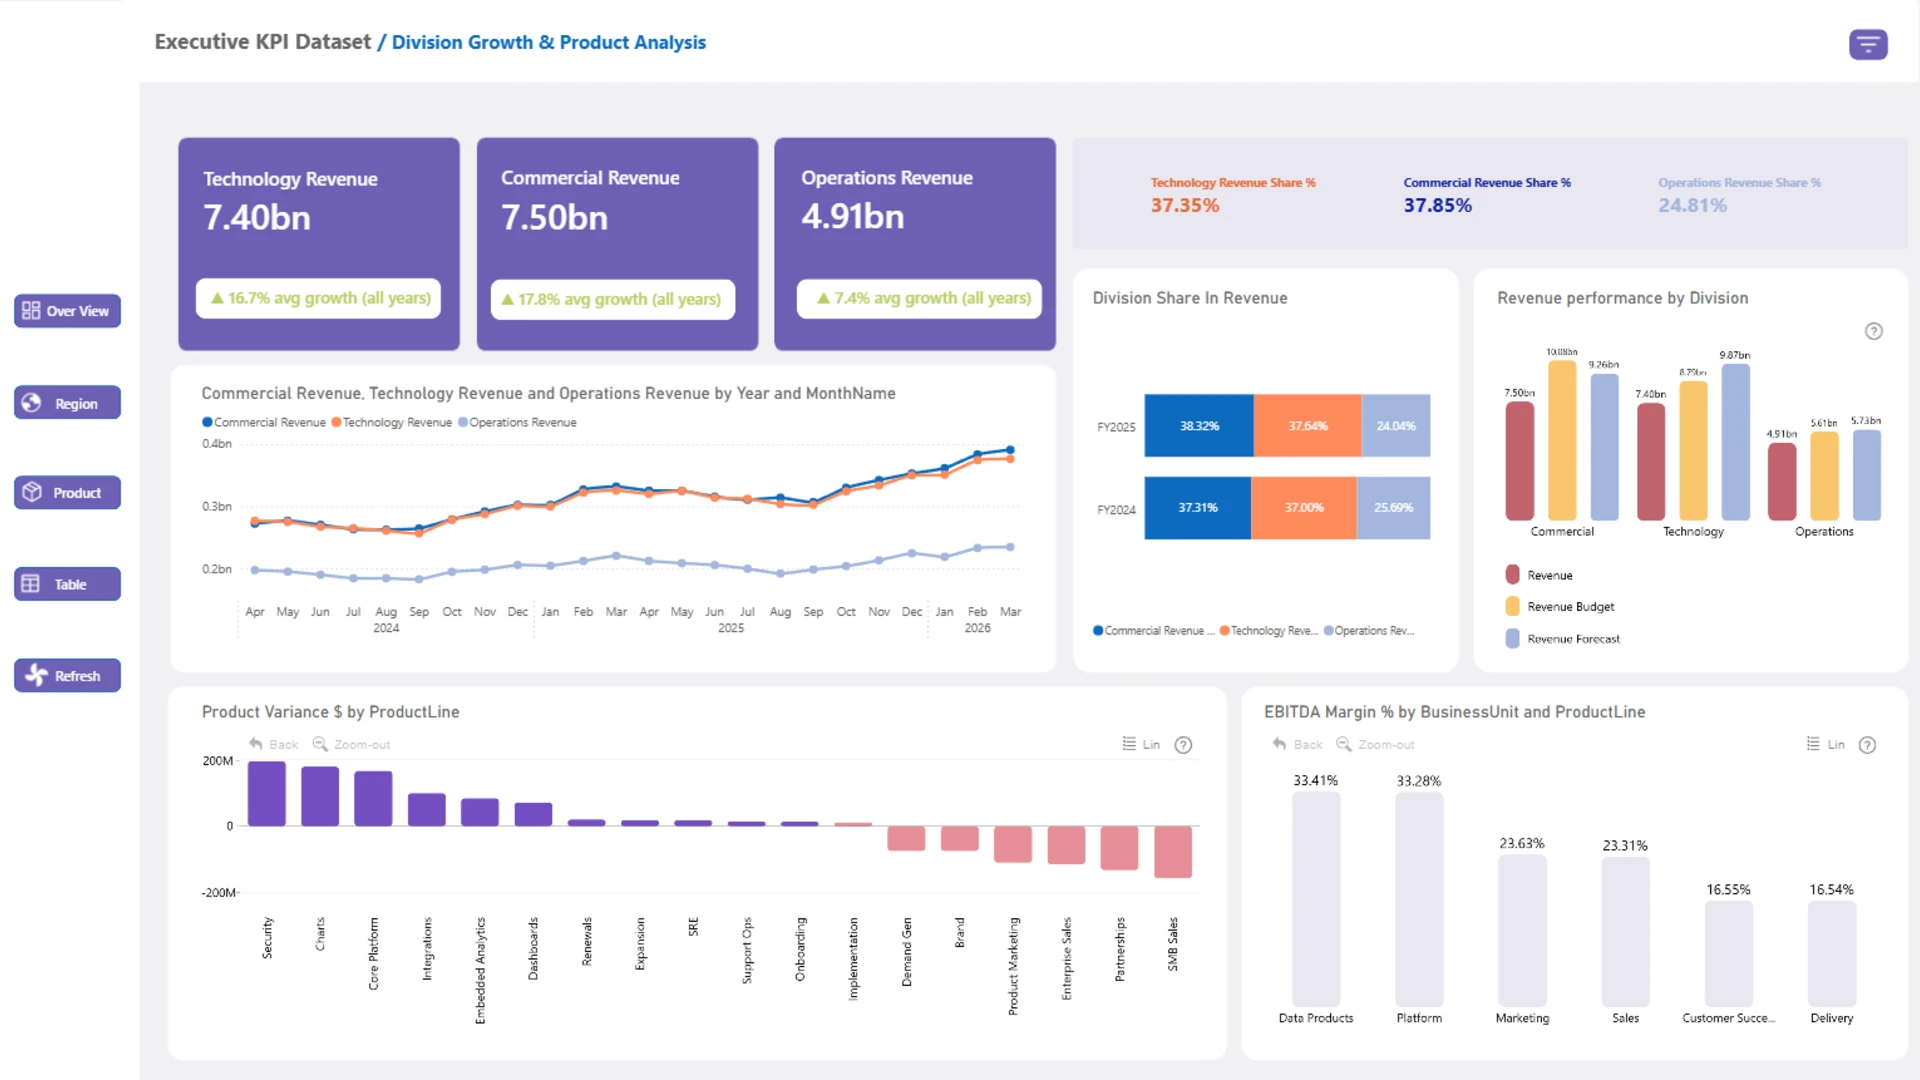
- Organizational drill-down: move from executive-level results into more detailed business structures
The dashboard uses Drill Down Shape Map, Combo, Combo Bar, and Donut PRO visuals. Interactive filtering and drill-down make it possible to explore KPI performance across different business dimensions without losing the wider executive overview.
This report was submitted to the ZoomCharts 4U Reports Challenge in April 2026.
How to Use This Power BI Executive KPI Dashboard
Click active chart elements and map regions to filter the report. Use the drill-down controls to move through the organizational hierarchy and examine the business areas contributing to budget or forecast differences.
Download the PBIX template to review the data model, calculations, visual settings, and report structure in Power BI Desktop. Replace the sample connection with your own business data to adapt the dashboard for executive KPI and budget-performance reporting.
ZoomCharts visuals used




4U Report Challenges
Participate in data challenges, build and submit reports to get free template downloads.
Join CommunityMobile view allows you to interact with the report. To Download the template please switch to desktop view.
How to use a PBIX template
Preview the interactive report, download the PBIX file, open it in Power BI Desktop, and replace the same data connection with your own dataset.
Preview and download
Explore the report online and download the PBIX template file.
Open in Power BI Desktop
Open the downloaded PBIX file in Power BI Desktop.
Connect your data
Replace the sample data source with your own dataset.
Refresh and adjust
Refresh the model and update fields or visual were needed.
Save and share
Save your report and publish it for your audience.


