227
Power BI Energy Site Comparison Dashboard
Power BI Energy Site Comparison Dashboard
More Report pages
Report Author: Pooja Nair
227
Share template with others
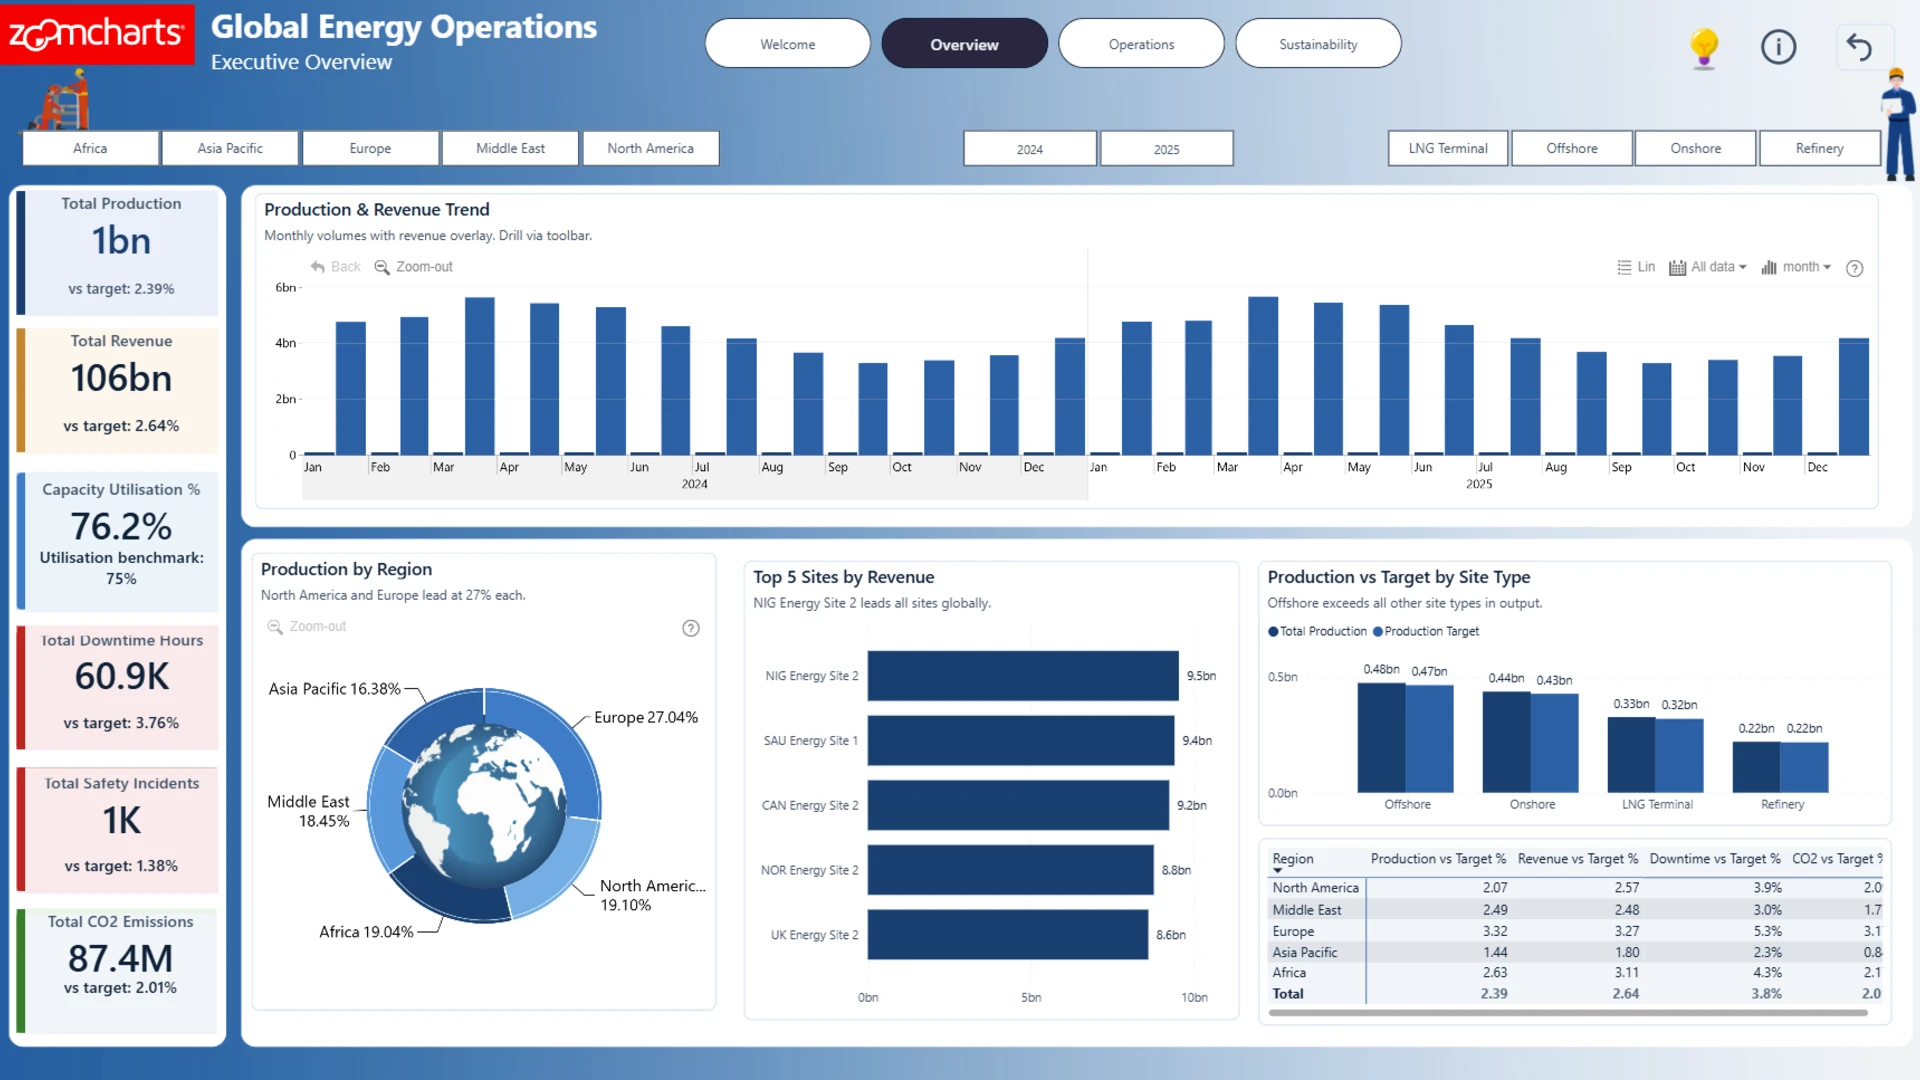
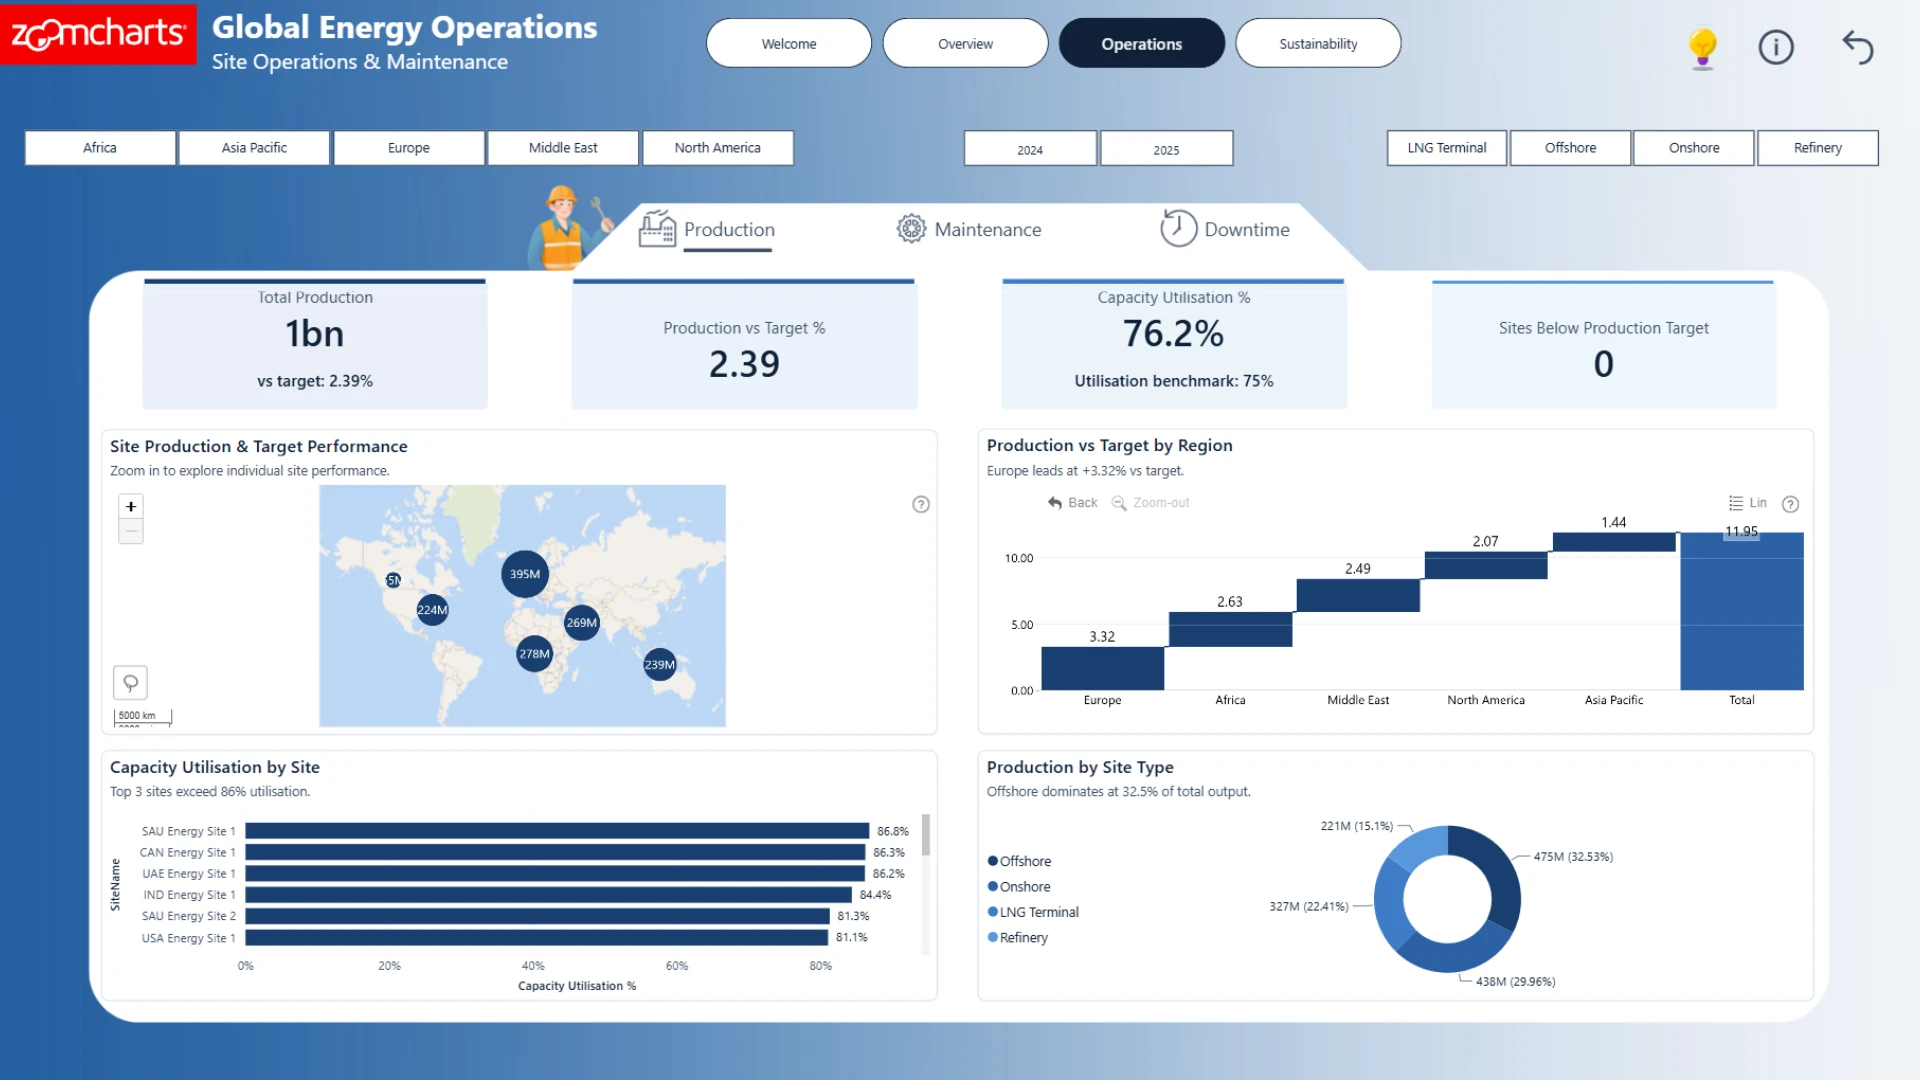
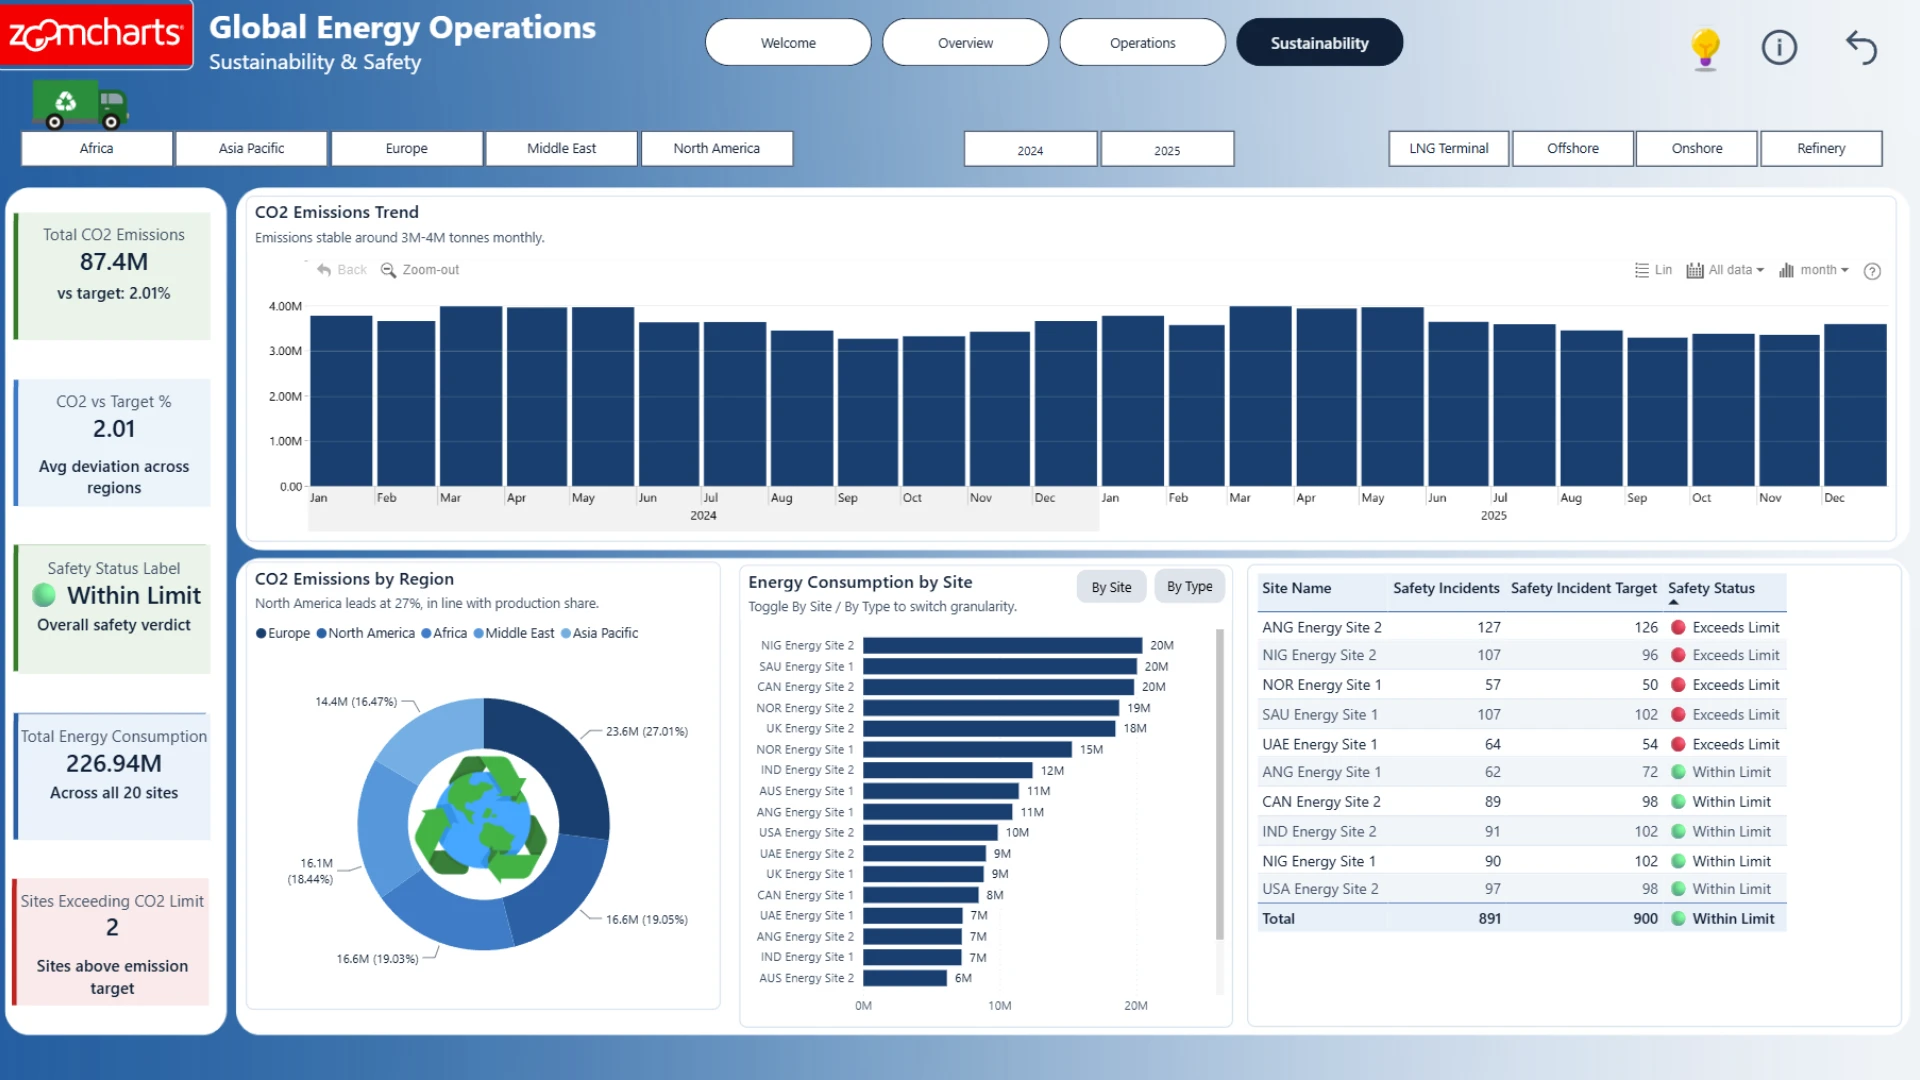
Explore an interactive Power BI dashboard for energy site comparison. Built with native Power BI visuals and ZoomCharts Drill Down Visuals, the report helps analyze production, maintenance, downtime, safety, sustainability, operational performance, and financial KPIs to support better business decisions. This report was created for the ZoomCharts 4U Report Challenge June 2026, where Power BI developers showcase their data visualization expertise by solving real-world business use cases using native Power BI visuals together with ZoomCharts Drill Down Visuals.
Author's description: A ZoomCharts 4U Challenge June 2026 submission built in Power BI, analysing executive intelligence across 20 oil, gas and energy sites spanning 5 global regions for FY 2024–25. Covers production performance vs target, site operations and maintenance, capacity utilisation, sustainability metrics, CO₂ emissions trends, and safety incidents by region and site type. Features ZoomCharts custom visuals, an animated oil rig welcome page, bookmark-driven interactivity, and a dark navy design system with amber accents. Built by Pooja Nair.
ZoomCharts visuals used
4U Report Challenges
Participate in data challenges, build and submit reports to get free template downloads.
Join CommunityMobile view allows you to interact with the report. To Download the template please switch to desktop view.


Was this helpful? Thank you for your feedback!
Sorry about that.
How can we improve it?