1025
Pharmacy Sales and Profitability Analysis 7
Pharmacy Sales and Profitability Analysis 7
More Report pages
Report Author: Abhijit Basak
1025
Share template with others
This Power BI report uses the Pharmacy Sales and Profitability dataset. The report features ZoomCharts Drill Down PRO custom visuals for Power BI. It was submitted to the Onyx Data DataDNA ZoomCharts Mini Challenge in January - February 2026.
Author’s Description:
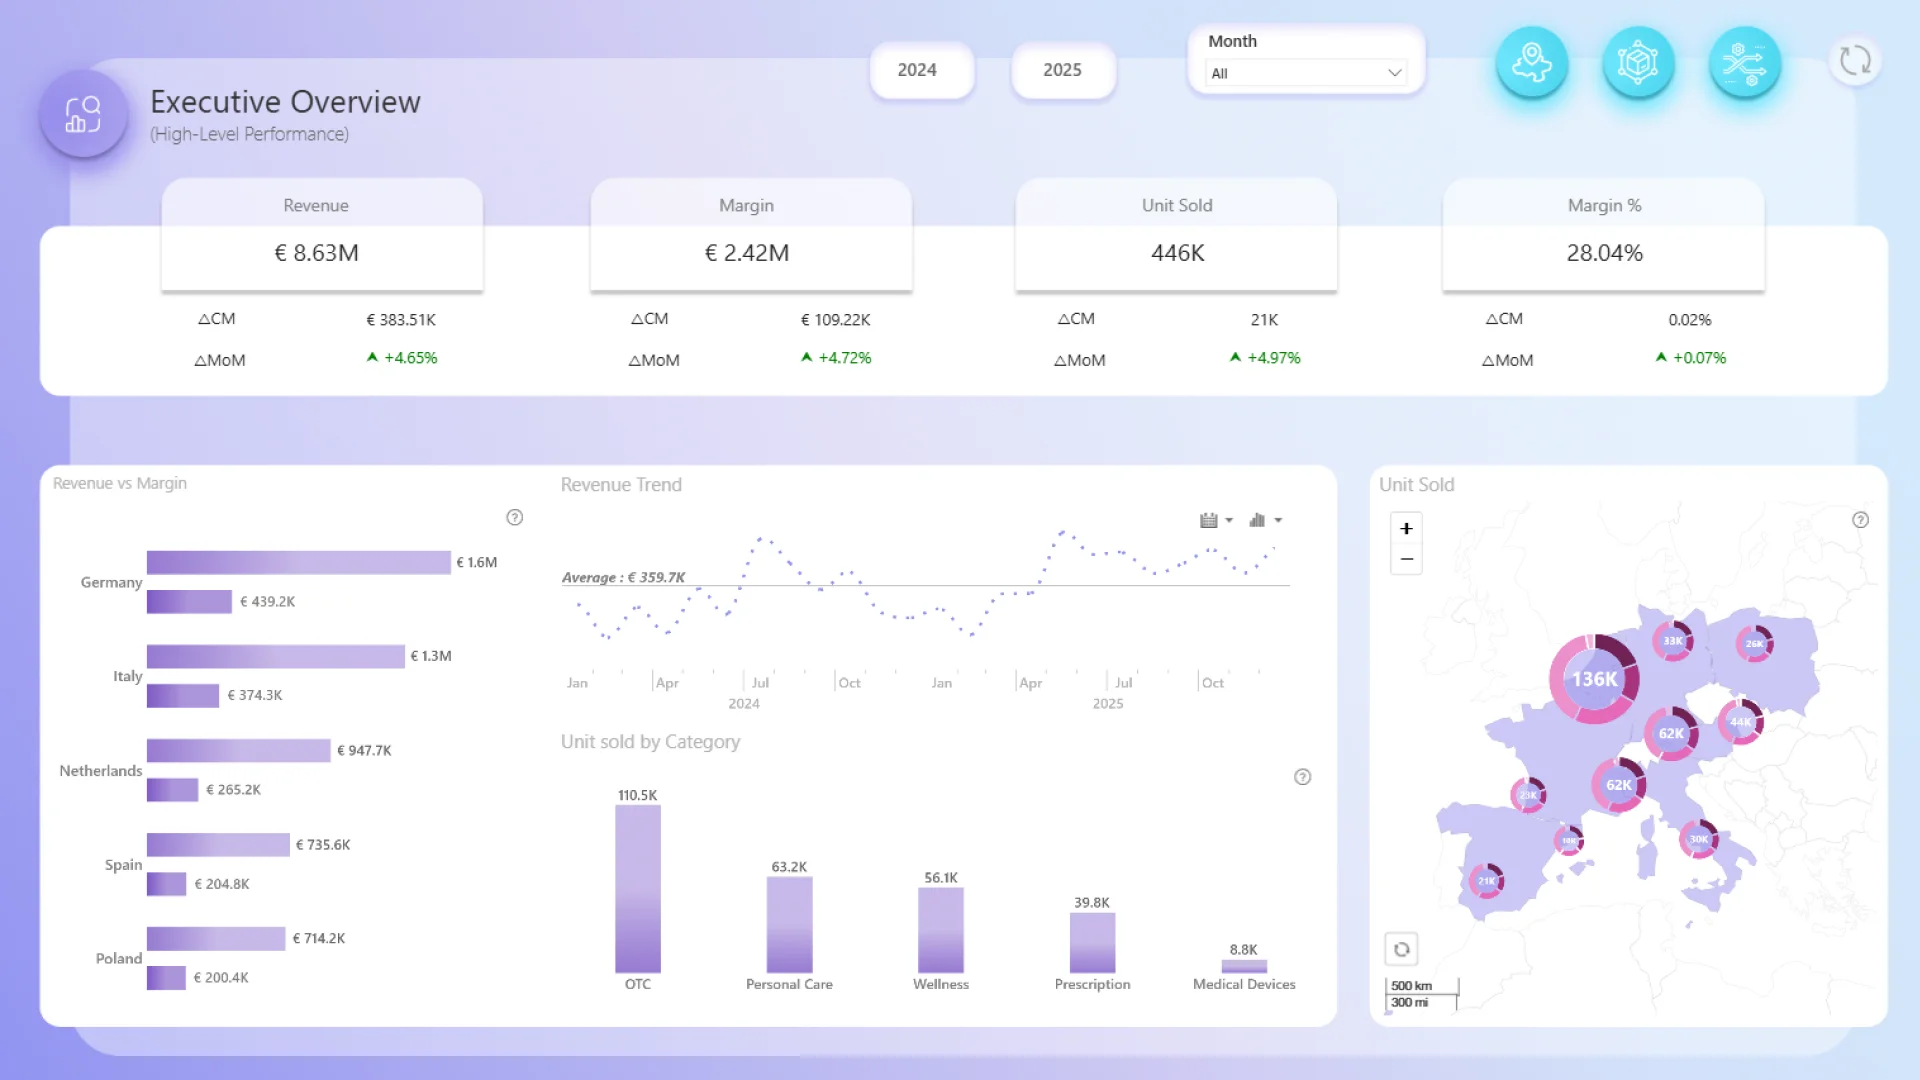
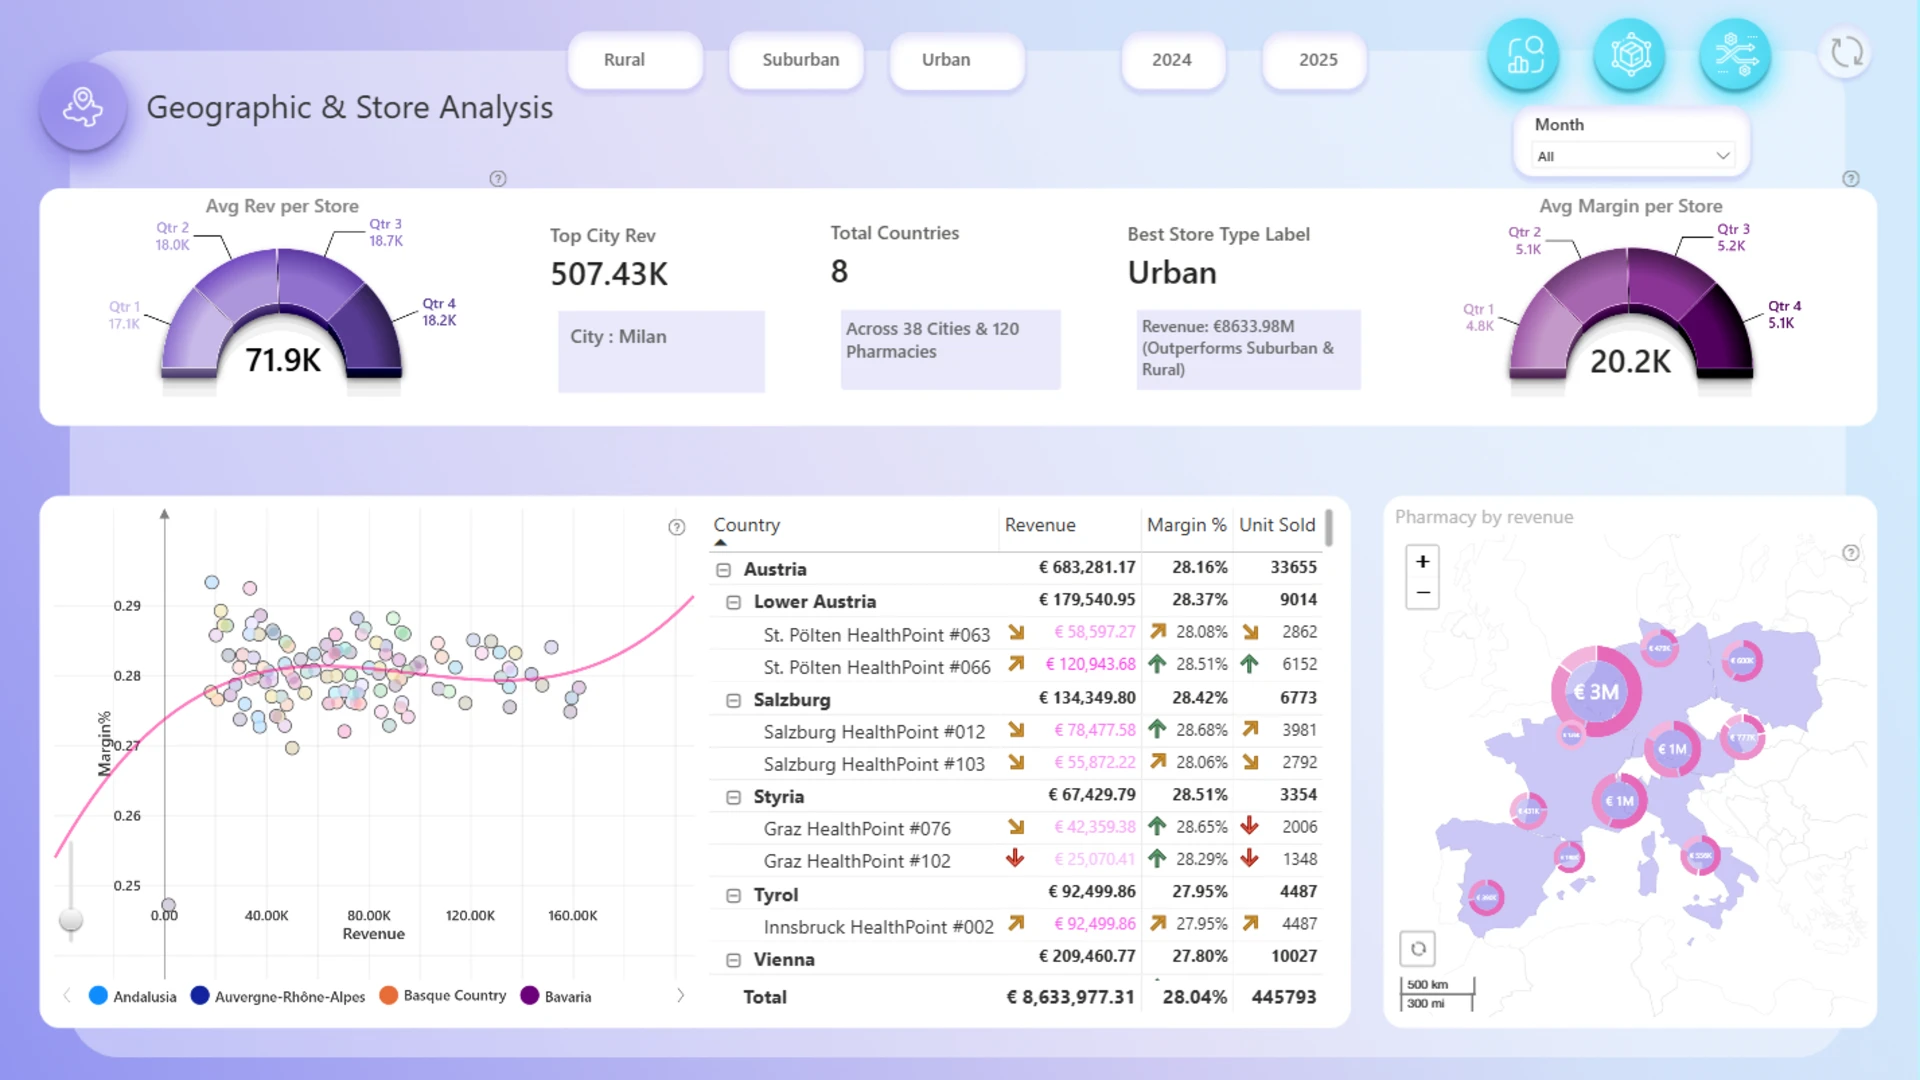
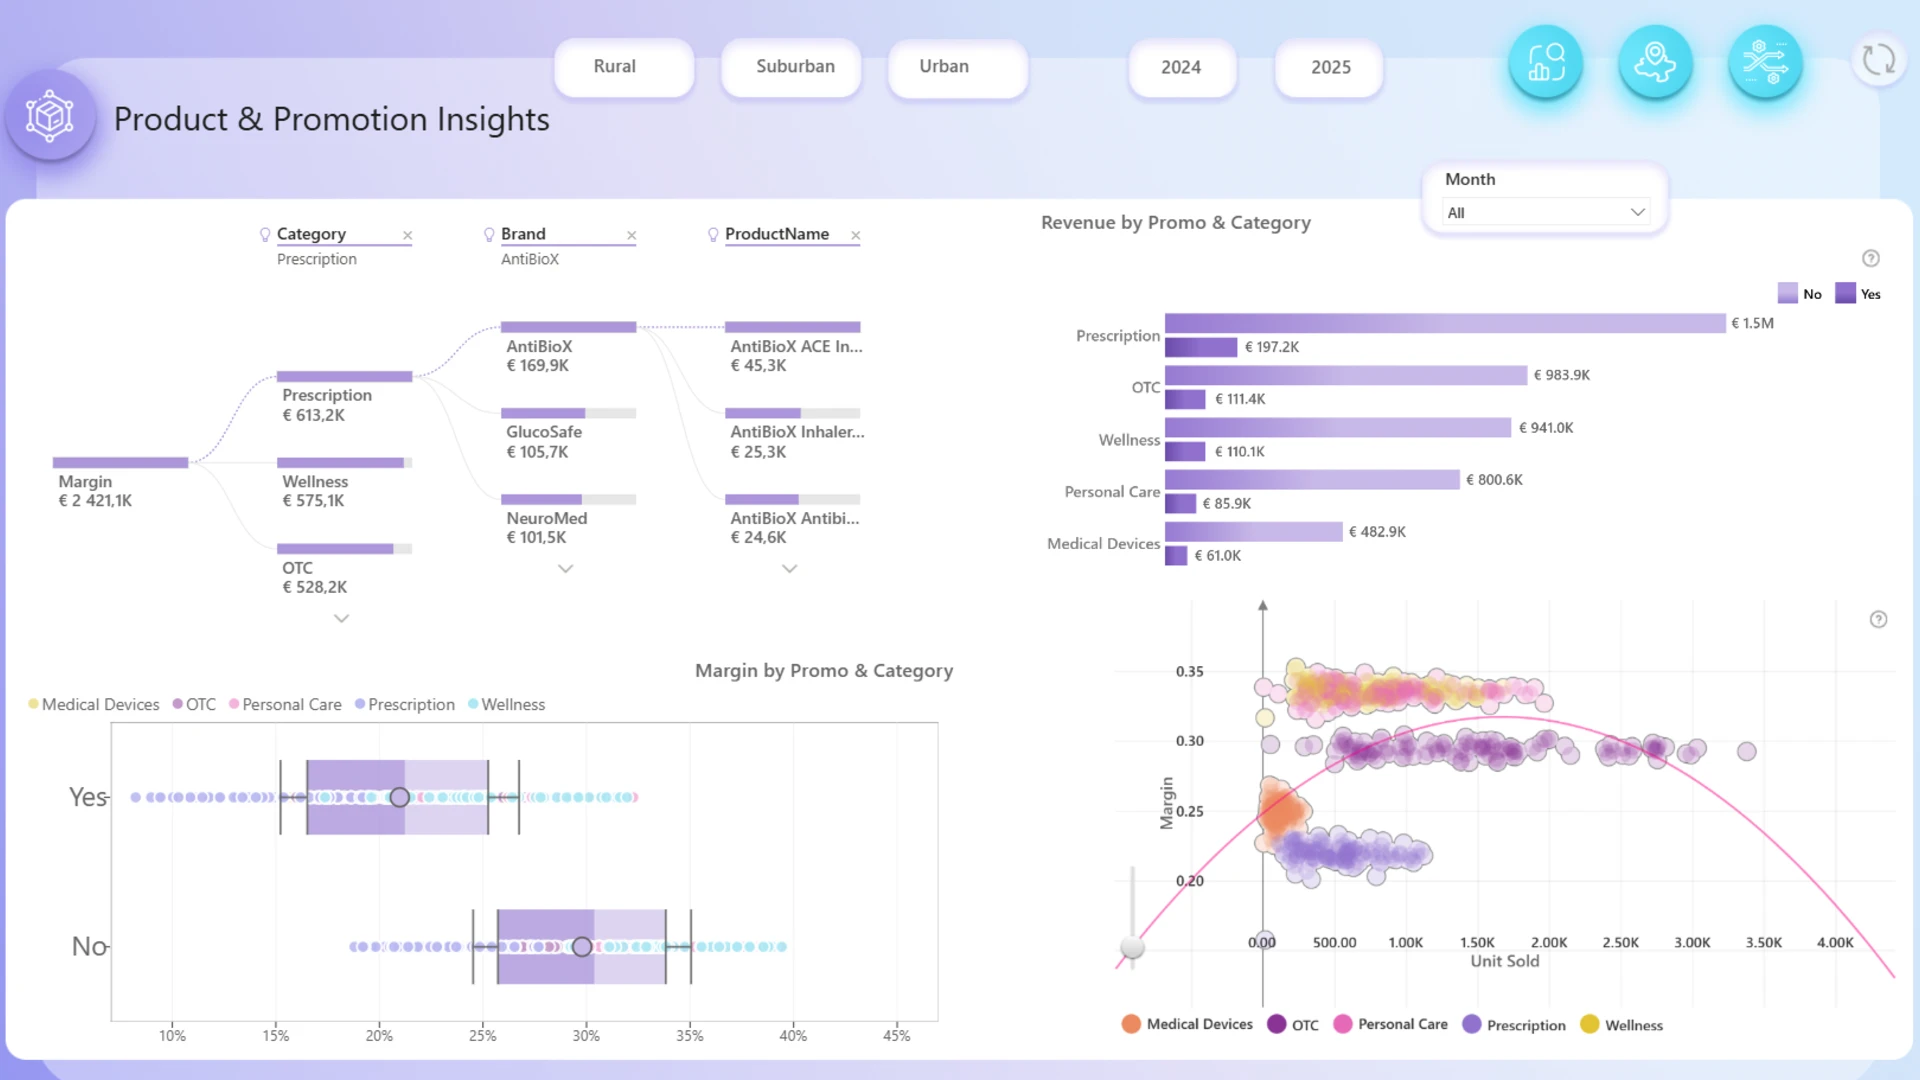
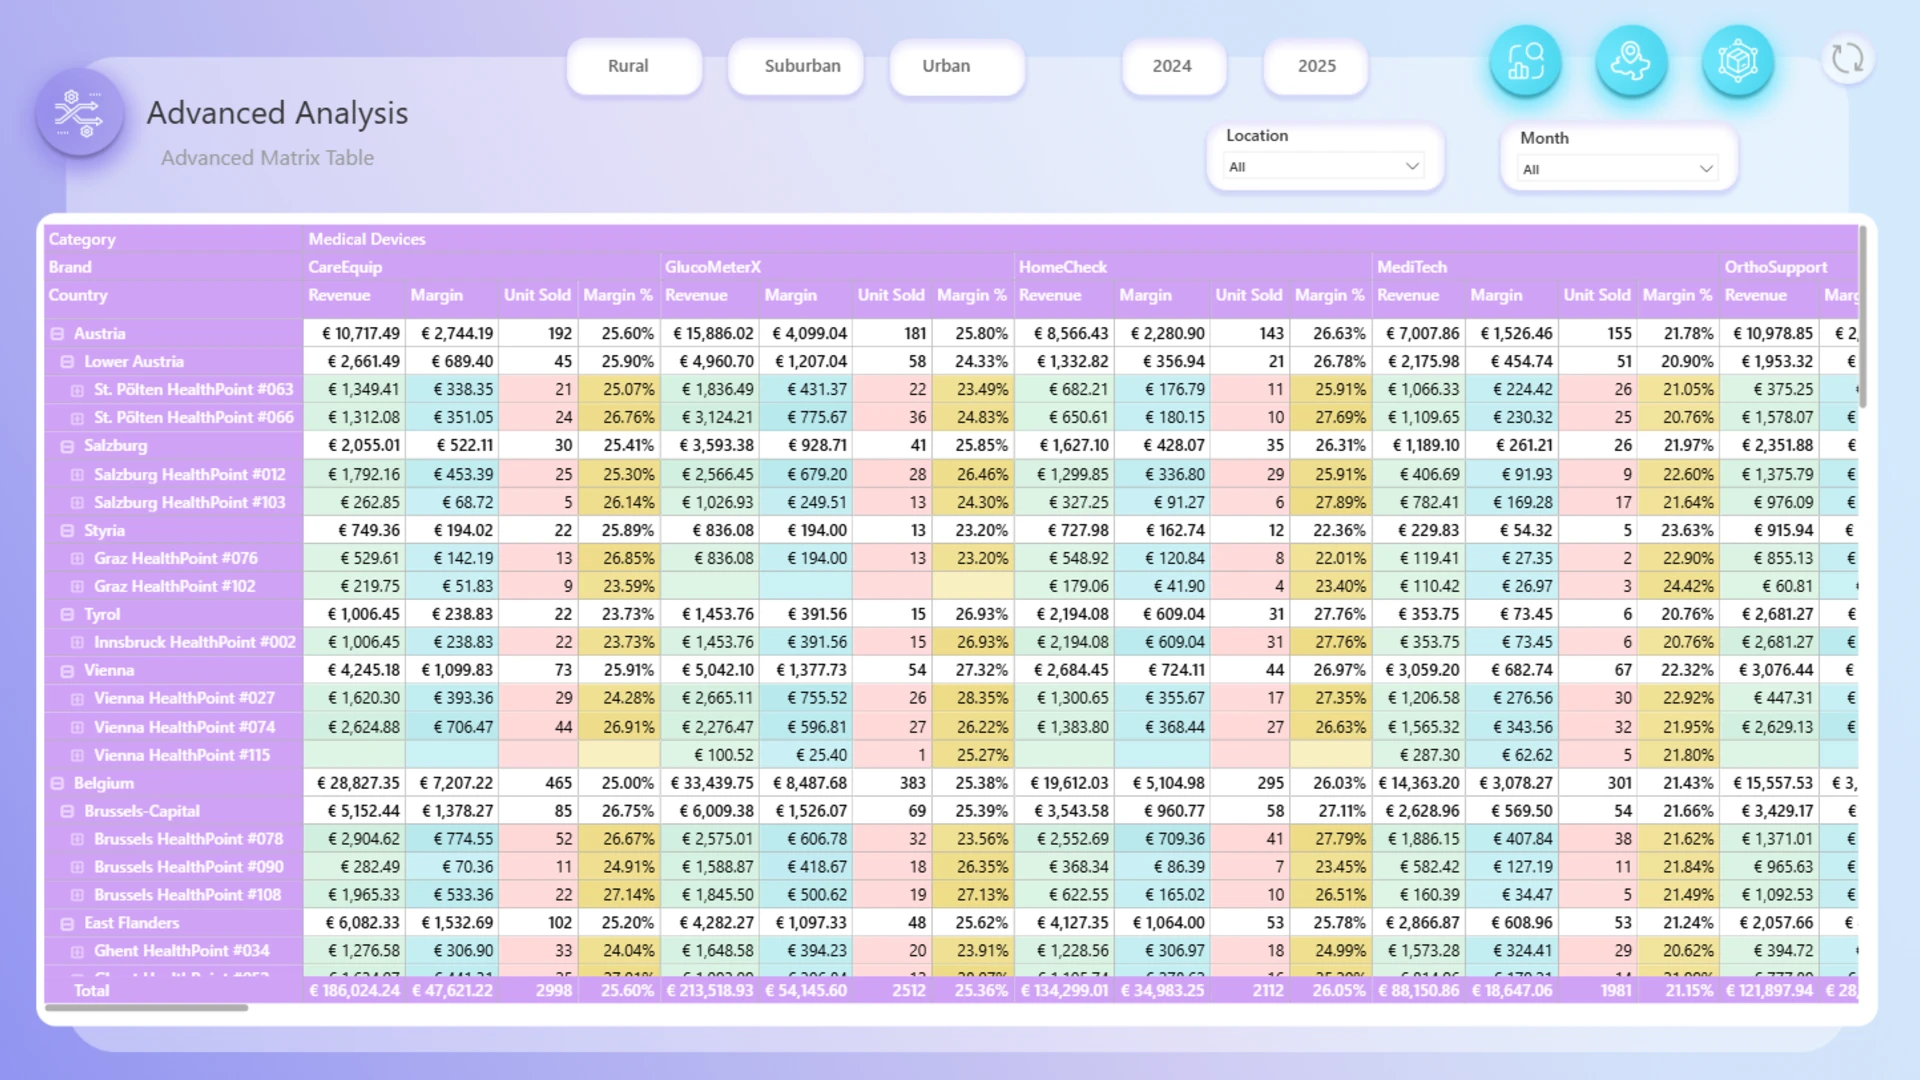
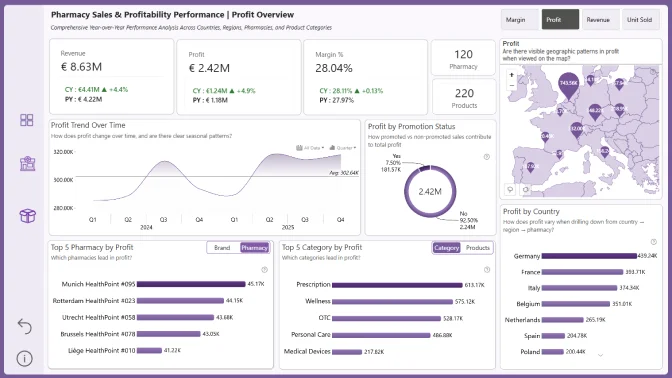
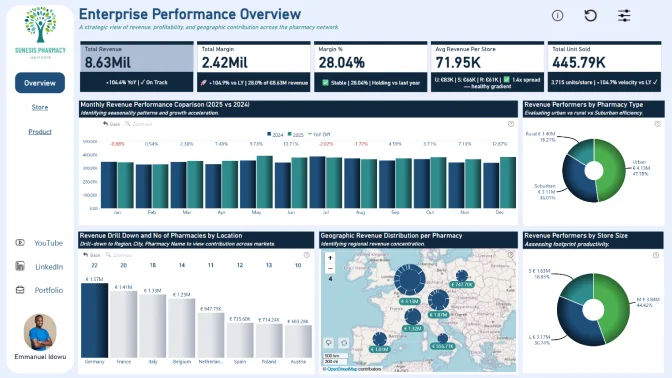
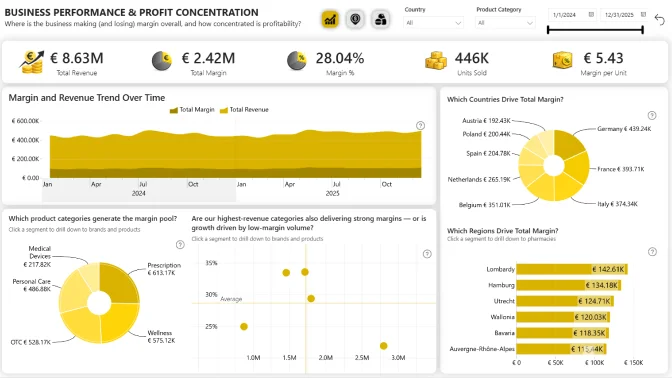
The Pharmacy Sales & Profitability Analytics dashboard, developed by ONYX DATA, analyzes the performance of a European pharmacy chain across 120 pharmacies in 38 cities and 8 countries during fiscal years 2024 and 2025. The analysis reports total revenue of €8.63 million, a total margin of €2.42 million, and an overall margin rate of 28.04%, based on 446,000 units sold. Structured into four sections-Executive Overview, Geographic & Store Analysis, Product & Promotion Insights, and Advanced Analysis-the dashboard evaluates performance across five product categories, with Prescription as the primary revenue driver. Geographic benchmarking highlights Urban locations as the strongest-performing store type, with cities such as Milan generating particularly high revenue.
ZoomCharts visuals used






4U Report Challenges
Participate in data challenges, build and submit reports to get free template downloads.
Join CommunityMobile view allows you to interact with the report. To Download the template please switch to desktop view.
How to use a PBIX template
Preview the interactive report, download the PBIX file, open it in Power BI Desktop, and replace the same data connection with your own dataset.
Preview and download
Explore the report online and download the PBIX template file.
Open in Power BI Desktop
Open the downloaded PBIX file in Power BI Desktop.
Connect your data
Replace the sample data source with your own dataset.
Refresh and adjust
Refresh the model and update fields or visual were needed.
Save and share
Save your report and publish it for your audience.


