974
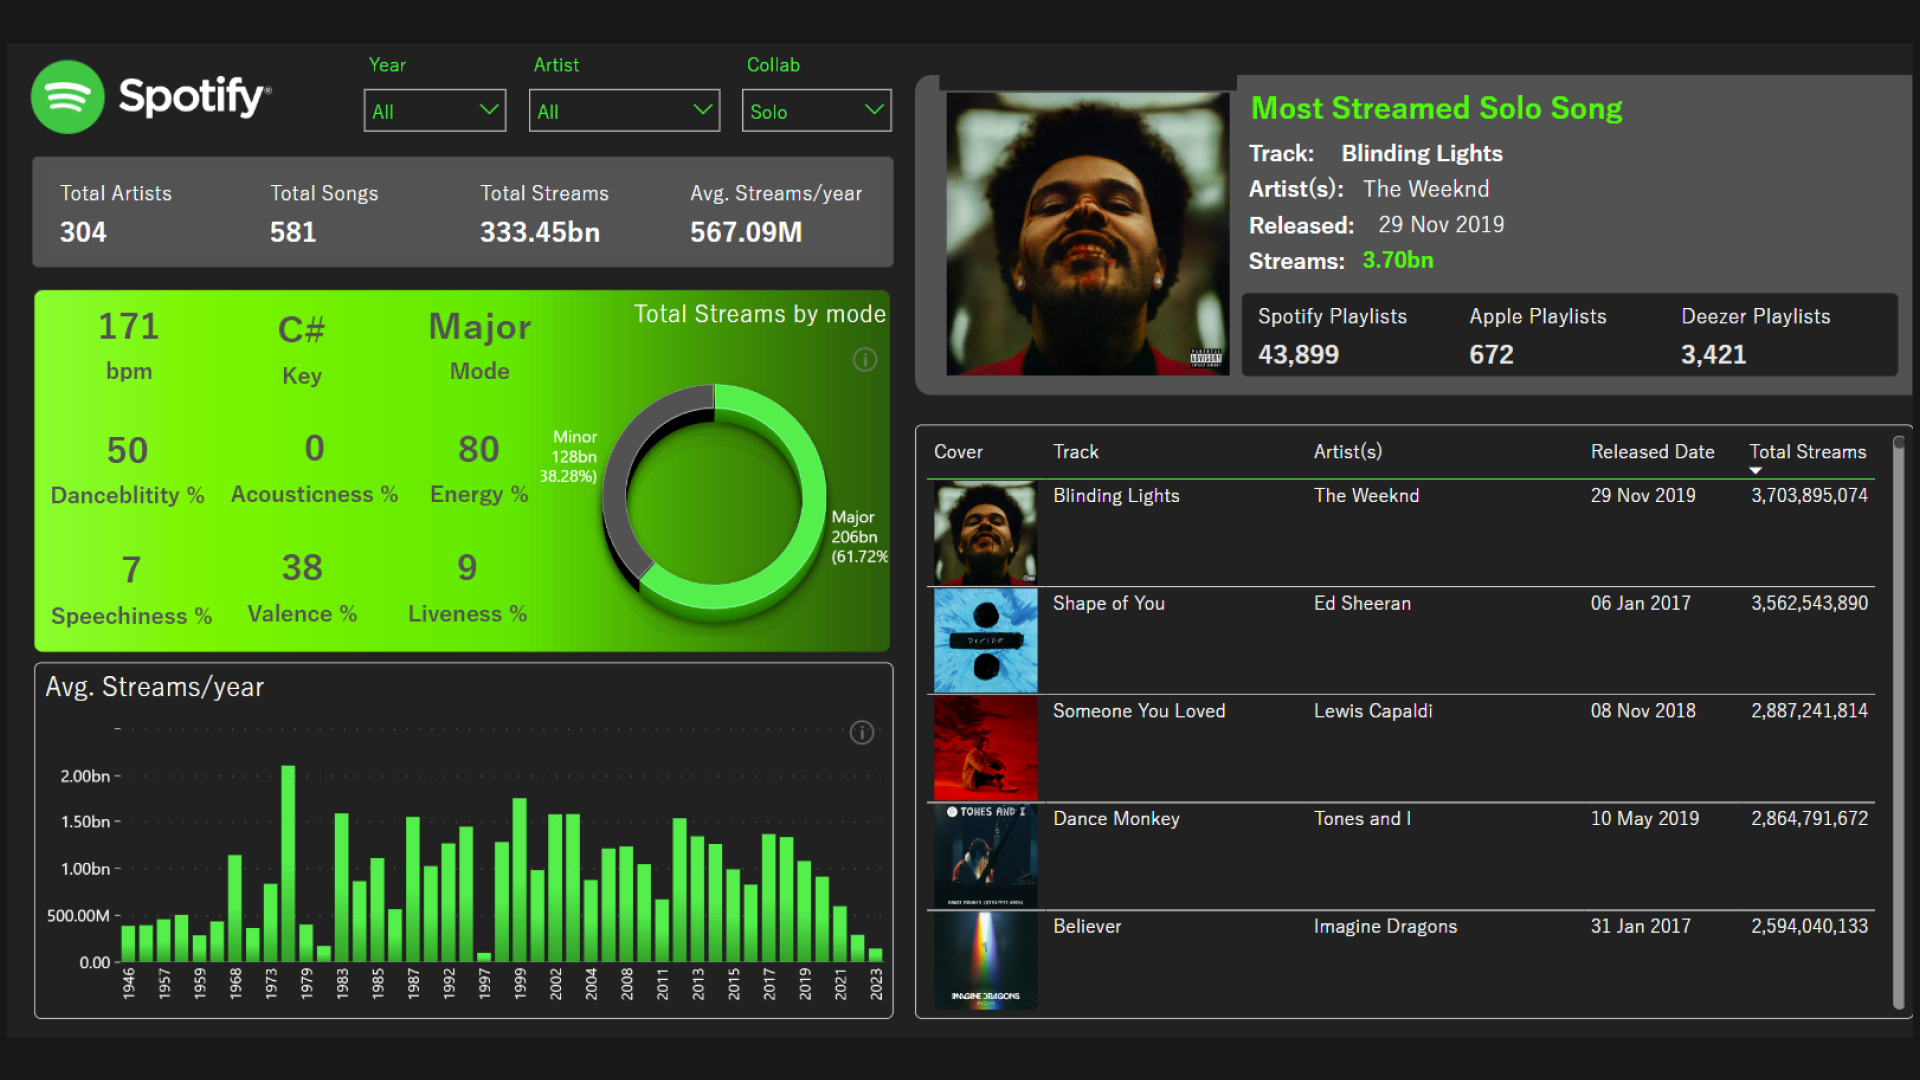
Onyx Data Spotify Most Streamed Songs
Onyx Data Spotify Most Streamed Songs
Report Author: Mayank Singh Rajawat
974
Share template with others
Report submitted for Onyx Data DataDNA ZoomCharts Mini Challenge, October 2023. The report was built based on Spotify dataset and includes ZoomCharts custom Drill Down PRO visuals for Power BI. Tools Used: Power BI/Excel KPIs: -Average streams per year -Most Streamed Artists -Most Streamed Songs _Year Wise Average streams _featured/solo artists,tracks,streams -streams by Major and Minor key
4U Report Challenges
Participate in data challenges, build and submit reports to get free template downloads.
Join CommunityMobile view allows you to interact with the report. To Download the template please switch to desktop view.
Was this helpful? Thank you for your feedback!
Sorry about that.
How can we improve it?