816
Onyx Data Merchandise Sales Report
Onyx Data Merchandise Sales Report
Report Author: Ankan Bandyopadhyay
816
Share template with others
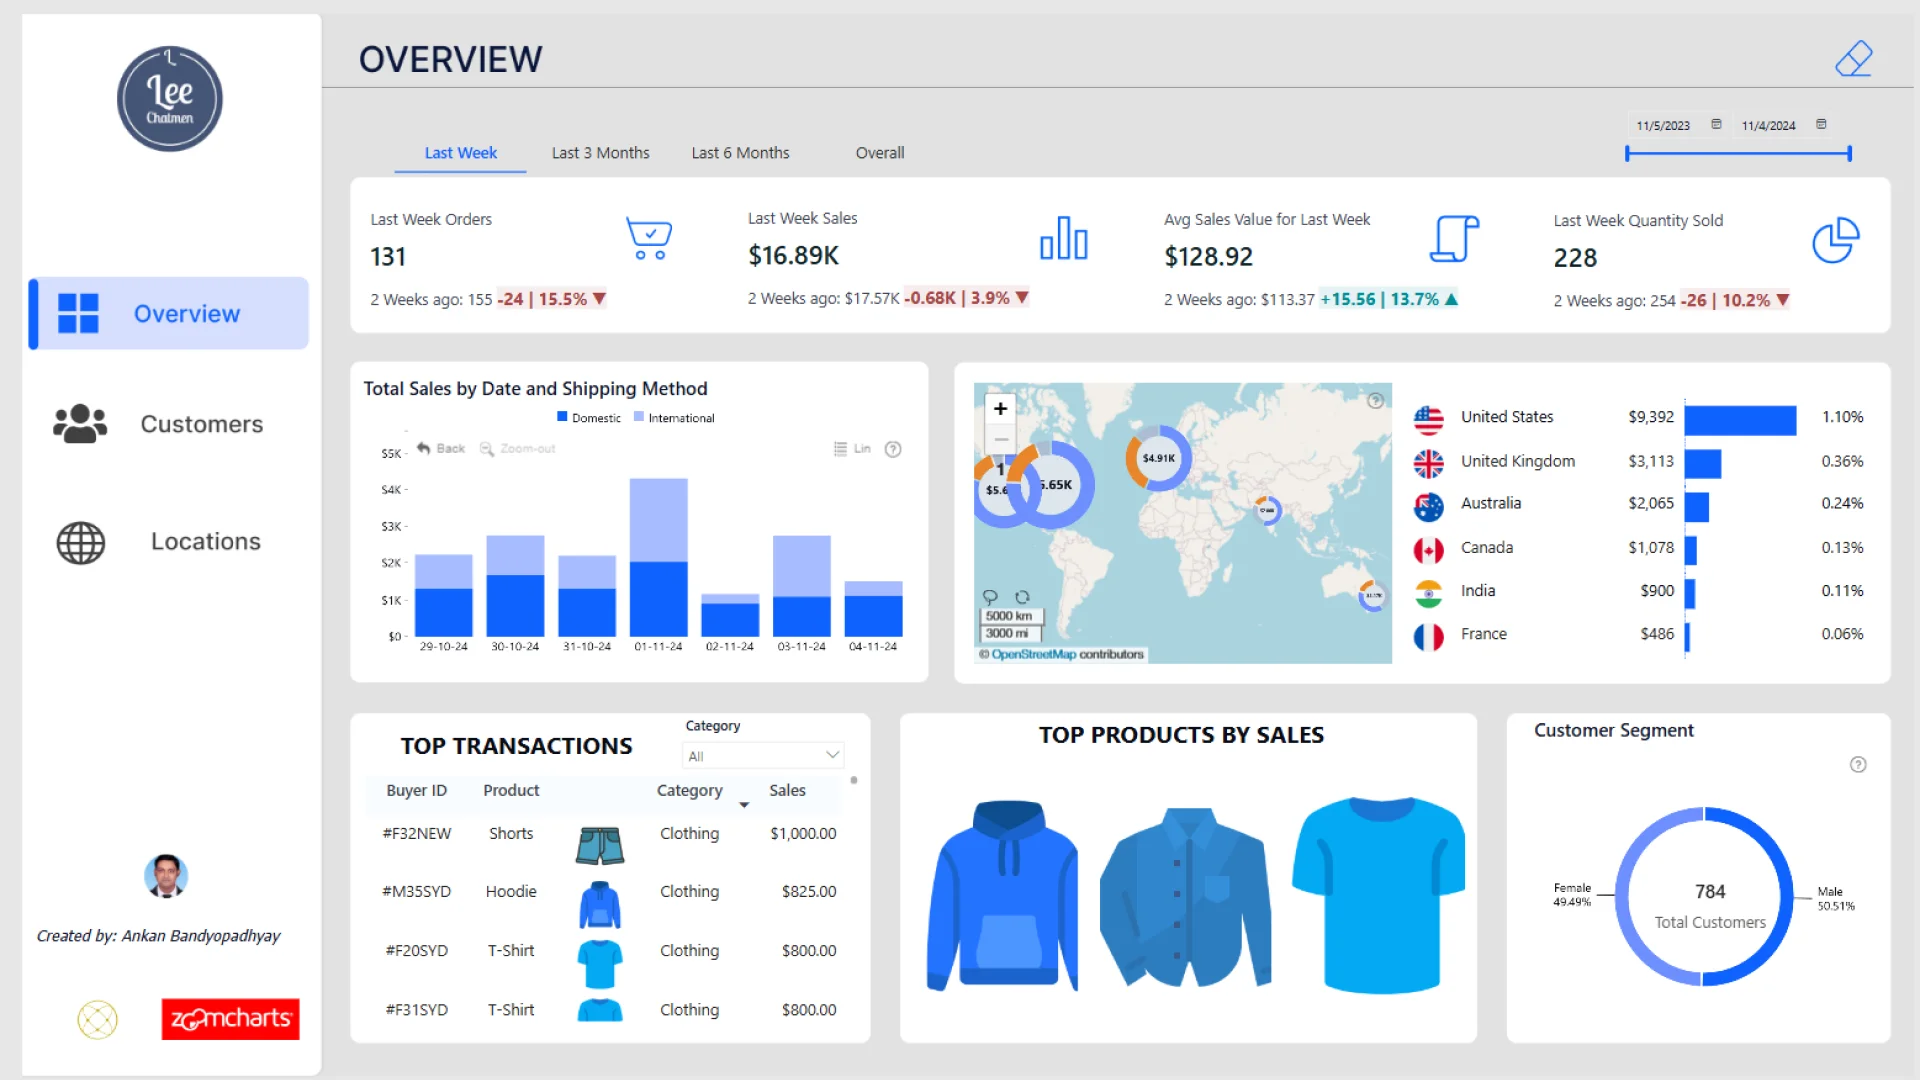
Report submitted for Onyx Data DataDNA ZoomCharts Mini Challenge, January 2025. The report is based on the Merchandise Sales dataset and includes ZoomCharts custom Drill Down PRO visuals for Power BI.
Author's description:
This interactive Power BI report provides a comprehensive analysis of Lee Chatmen's merchandise sales. It is divided into three key pages: Overview: A snapshot of key metrics like total sales, orders, and quantity sold, with breakdowns by shipping method, top transactions, and products. Customers: Insights into customer demographics, purchase patterns, average ratings, and age group analysis with detailed visuals for repeat purchases and spending trends. Locations: A geographic analysis of sales, shipping charges, and average ratings across cities and countries, highlighting top-performing regions. The report is designed with dynamic filters (Last Week, Last 3 Months, Last 6 Months) to provide actionable insights and enhance decision-making.
ZoomCharts visuals used
4U Report Challenges
Participate in data challenges, build and submit reports to get free template downloads.
Join CommunityMobile view allows you to interact with the report. To Download the template please switch to desktop view.
Was this helpful? Thank you for your feedback!
Sorry about that.
How can we improve it?