2626
Merchandise Sales Dashboard for Power BI
Merchandise Sales Dashboard for Power BI
More Report pages
Report Author: Chakradhar Mantena
2626
Share template with others
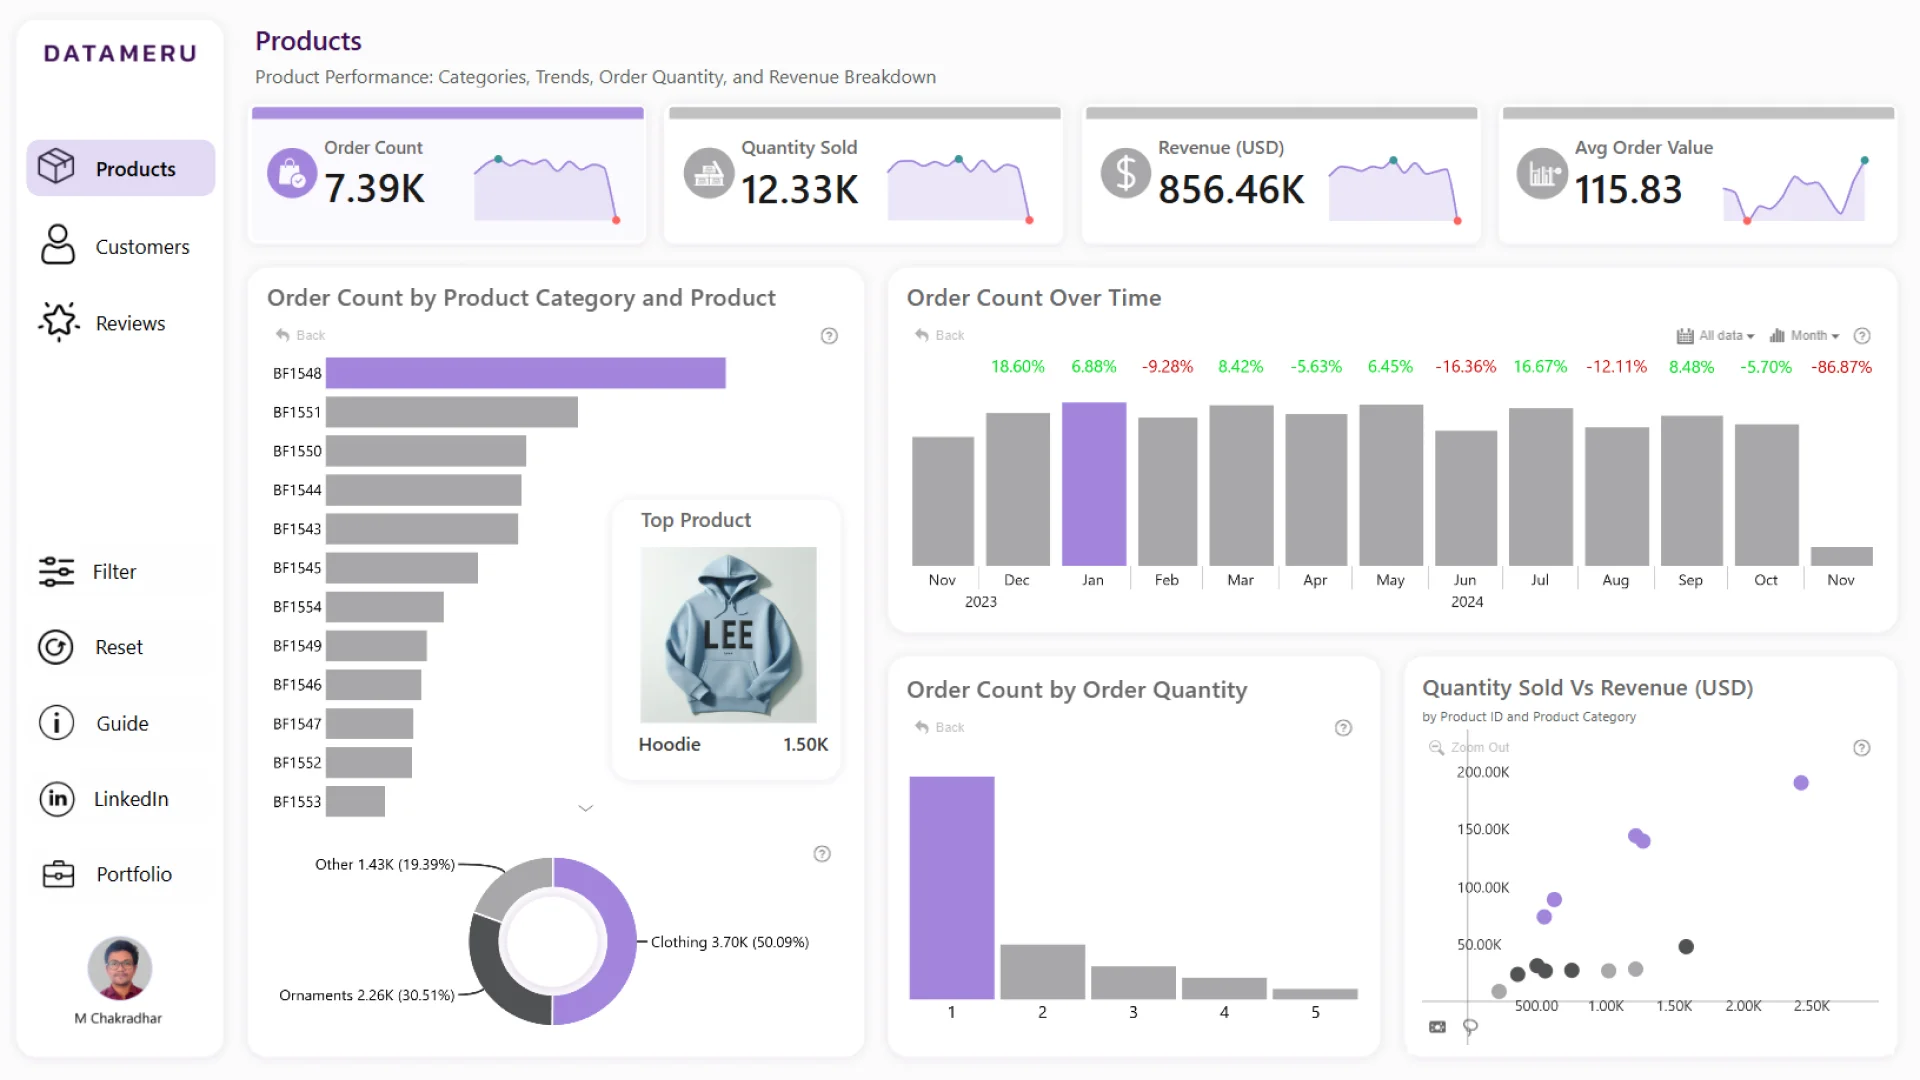
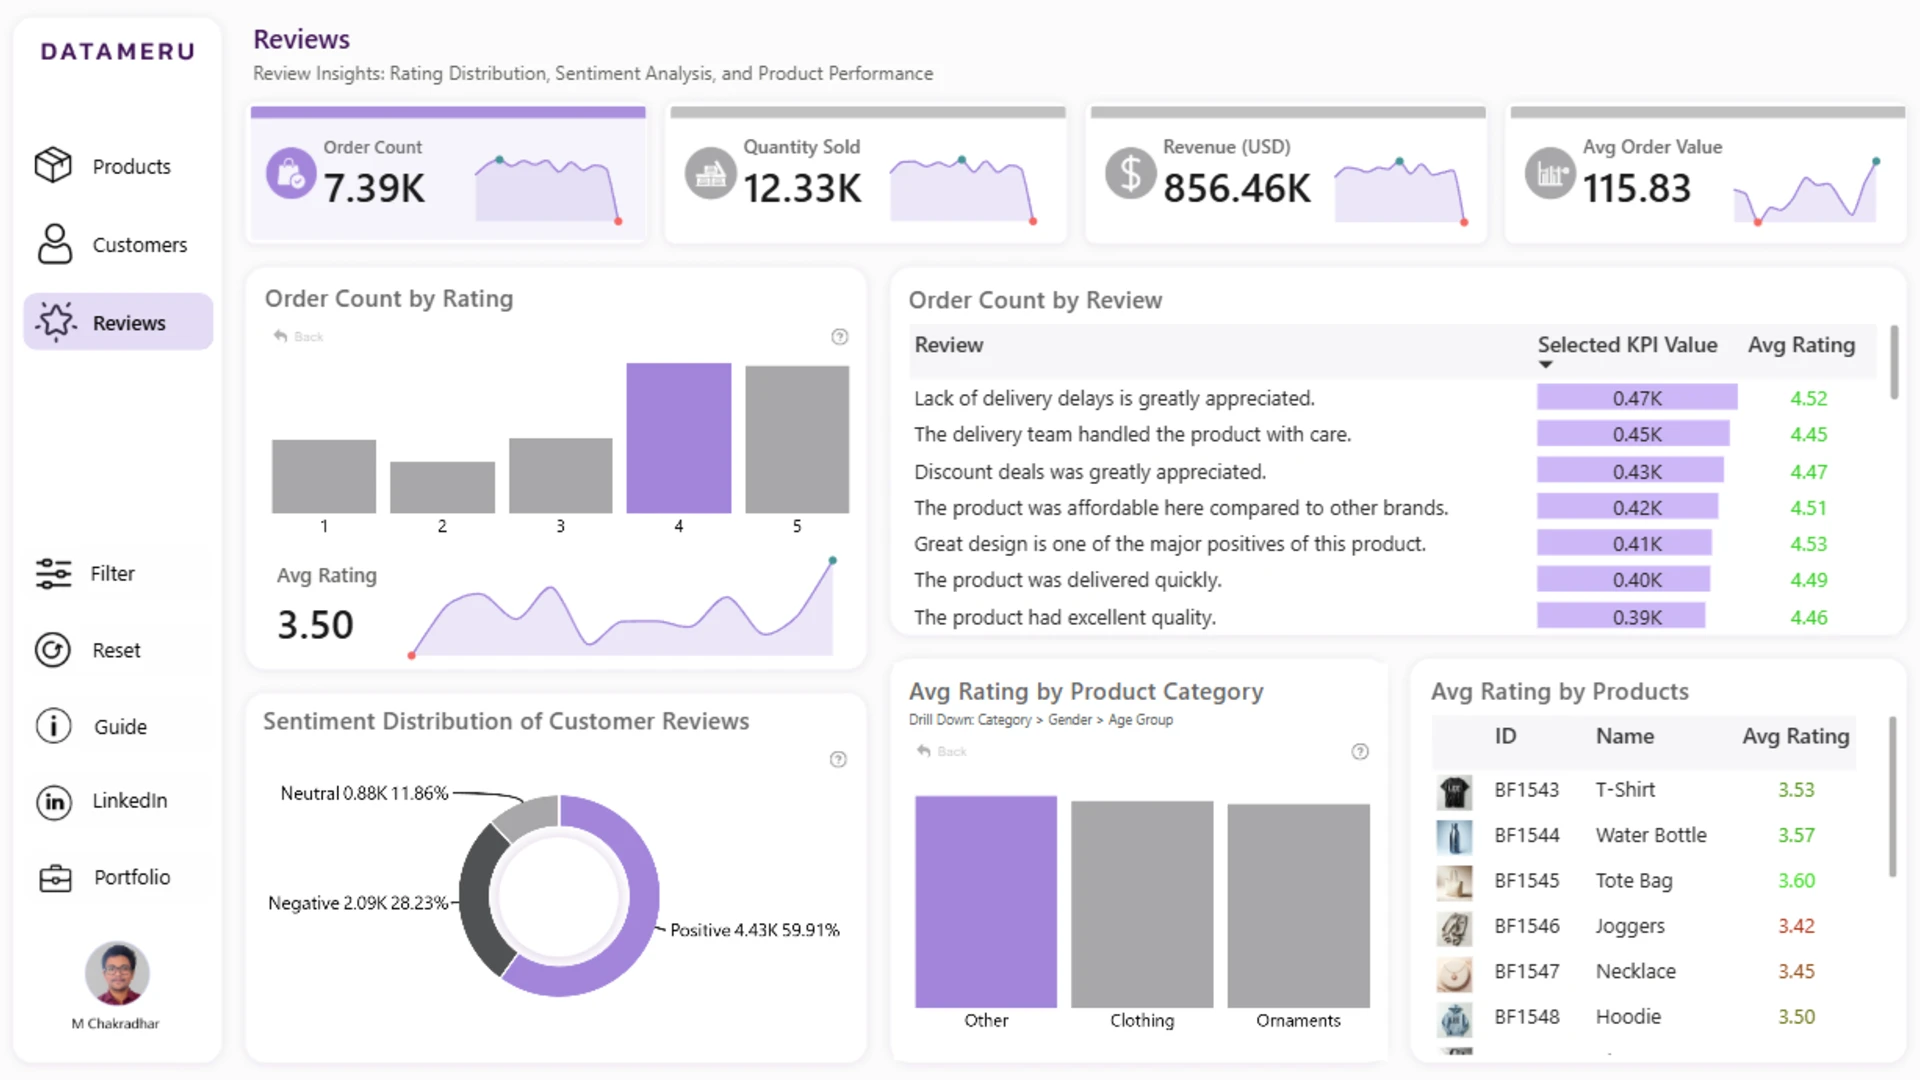
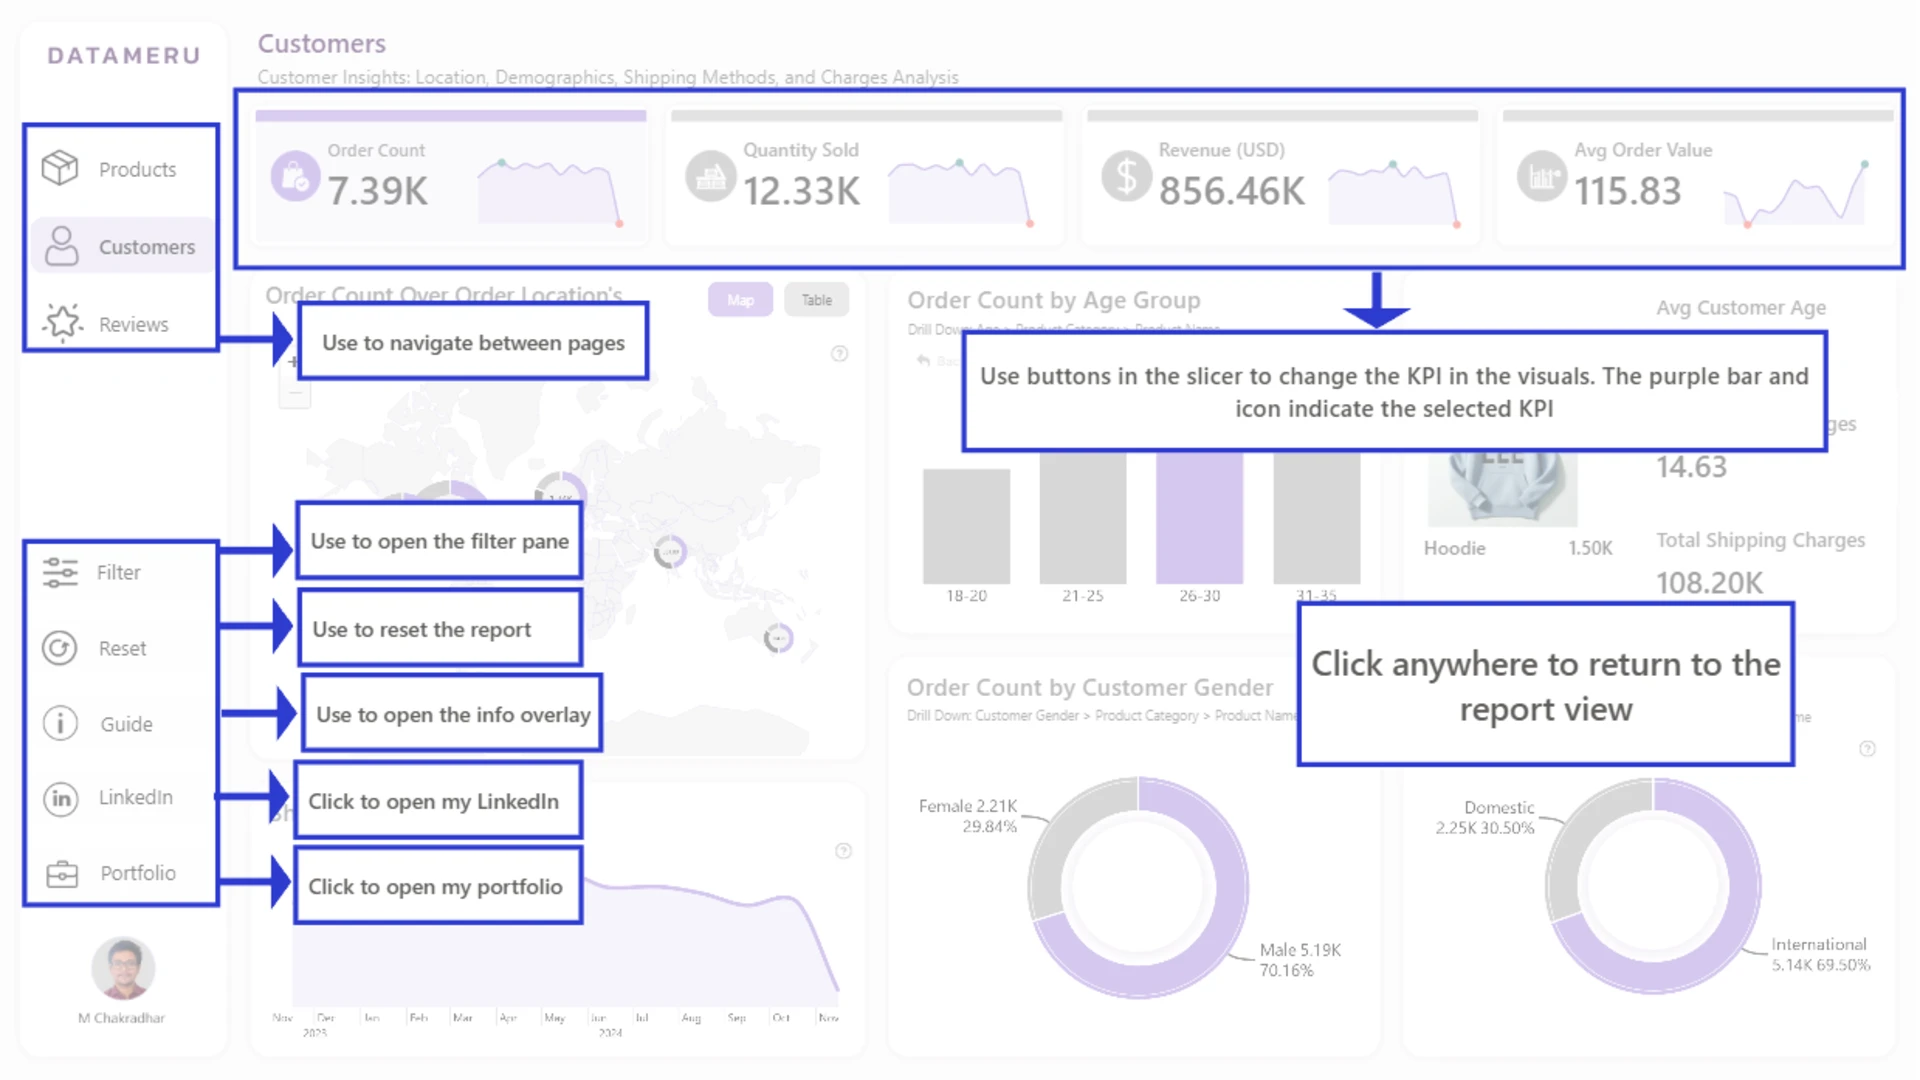
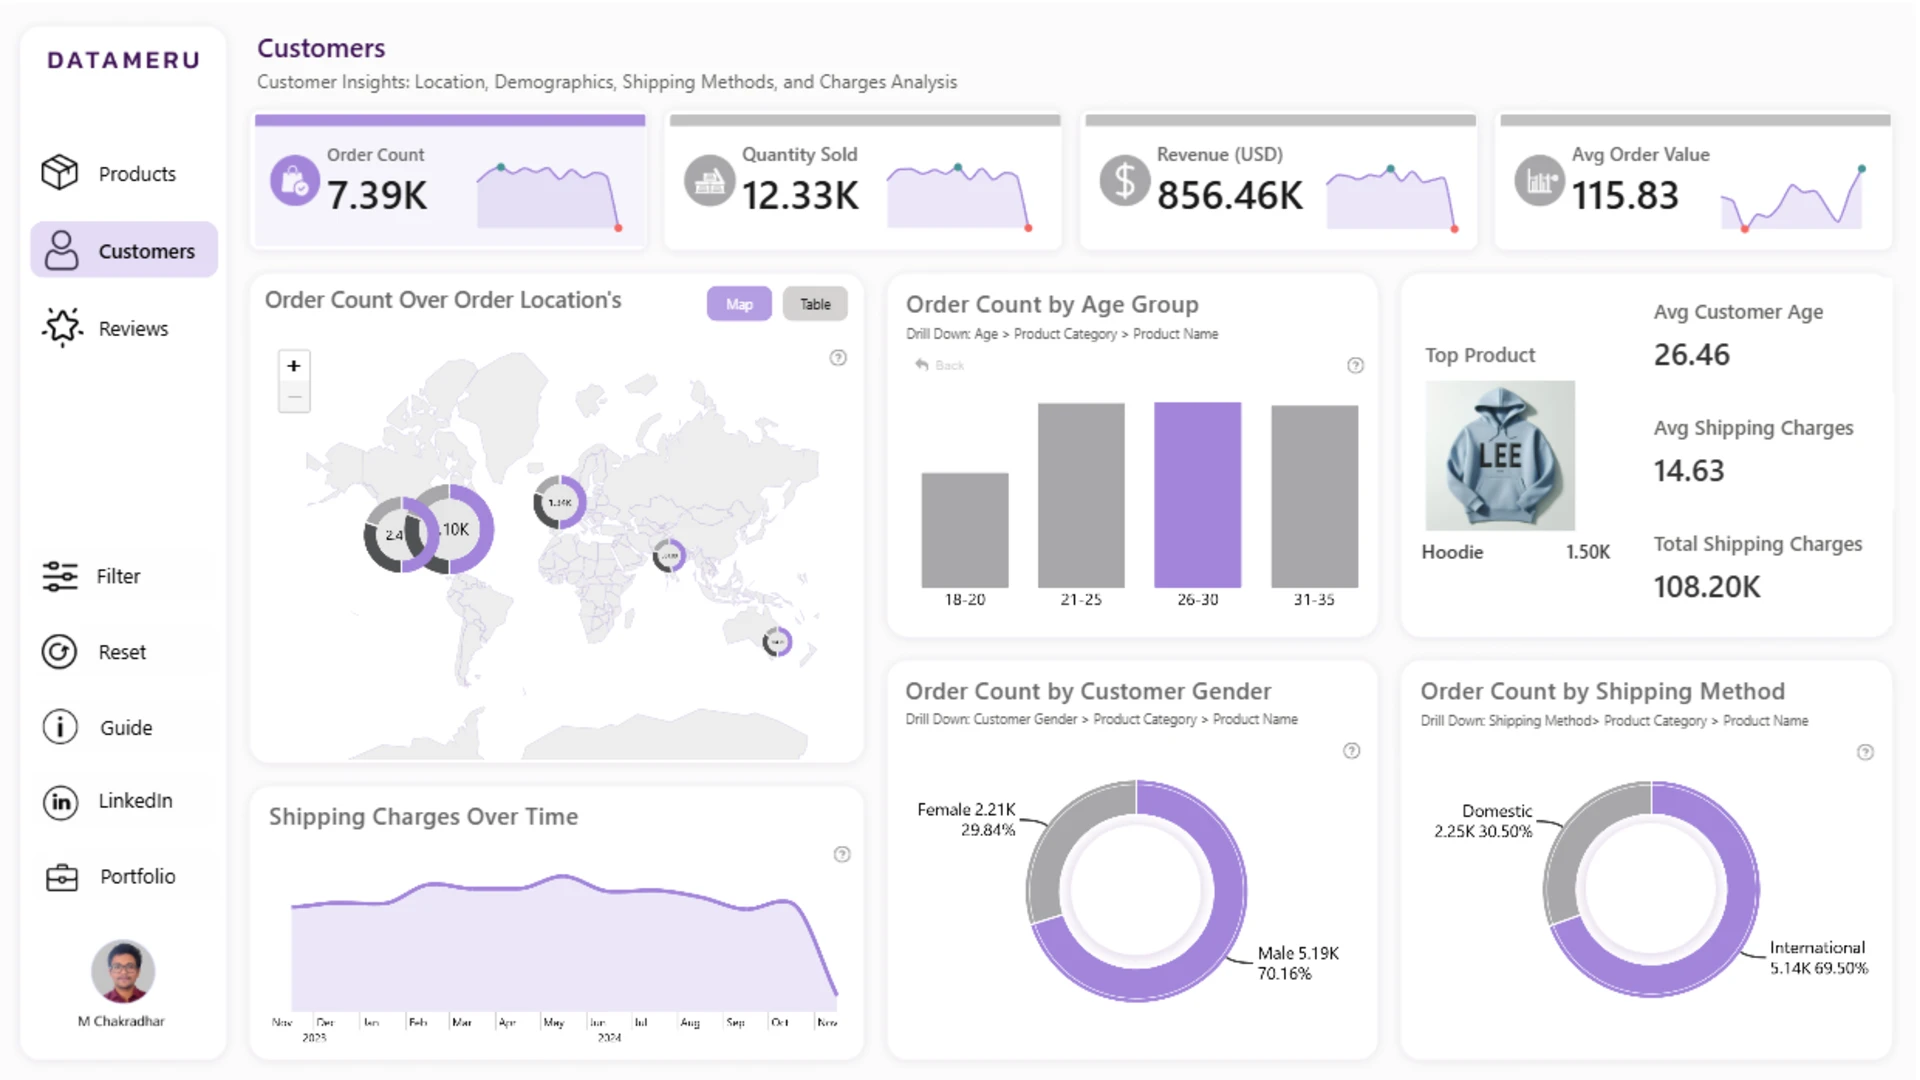
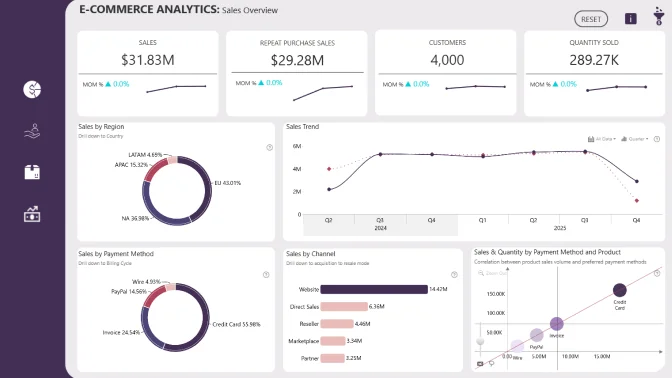
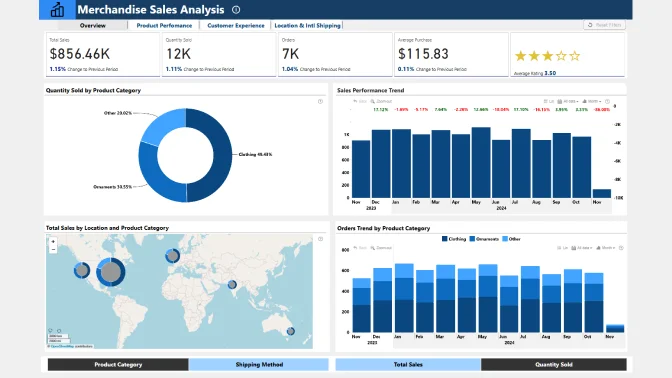
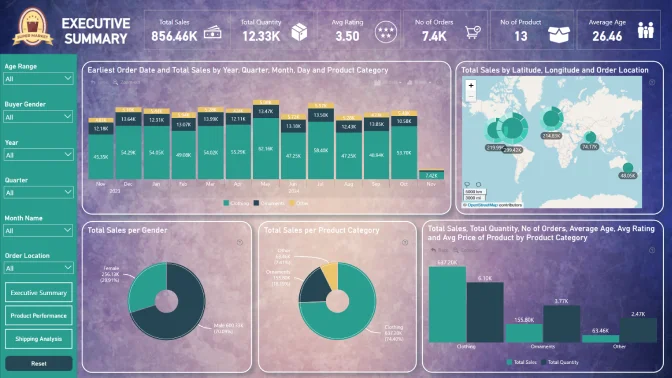
Explore a Power BI merchandise sales dashboard built to analyze ecommerce sales performance, product trends, customer behavior, and regional results. This report example uses interactive ZoomCharts Drill Down PRO and Power BI native visuals, including scatter, combo, combo bar, map, timeline, and donut visuals, to help users investigate merchandise sales data from multiple angles and identify patterns across categories, time periods, and locations.
ZoomCharts visuals used
4U Report Challenges
Participate in data challenges, build and submit reports to get free template downloads.
Join CommunityMobile view allows you to interact with the report. To Download the template please switch to desktop view.
Was this helpful? Thank you for your feedback!
Sorry about that.
How can we improve it?