123
Oil & Gas Operations Report
Oil & Gas Operations Report
More Report pages
Report Author: SHANMUKHA RAO BEVARA
123
Share template with others
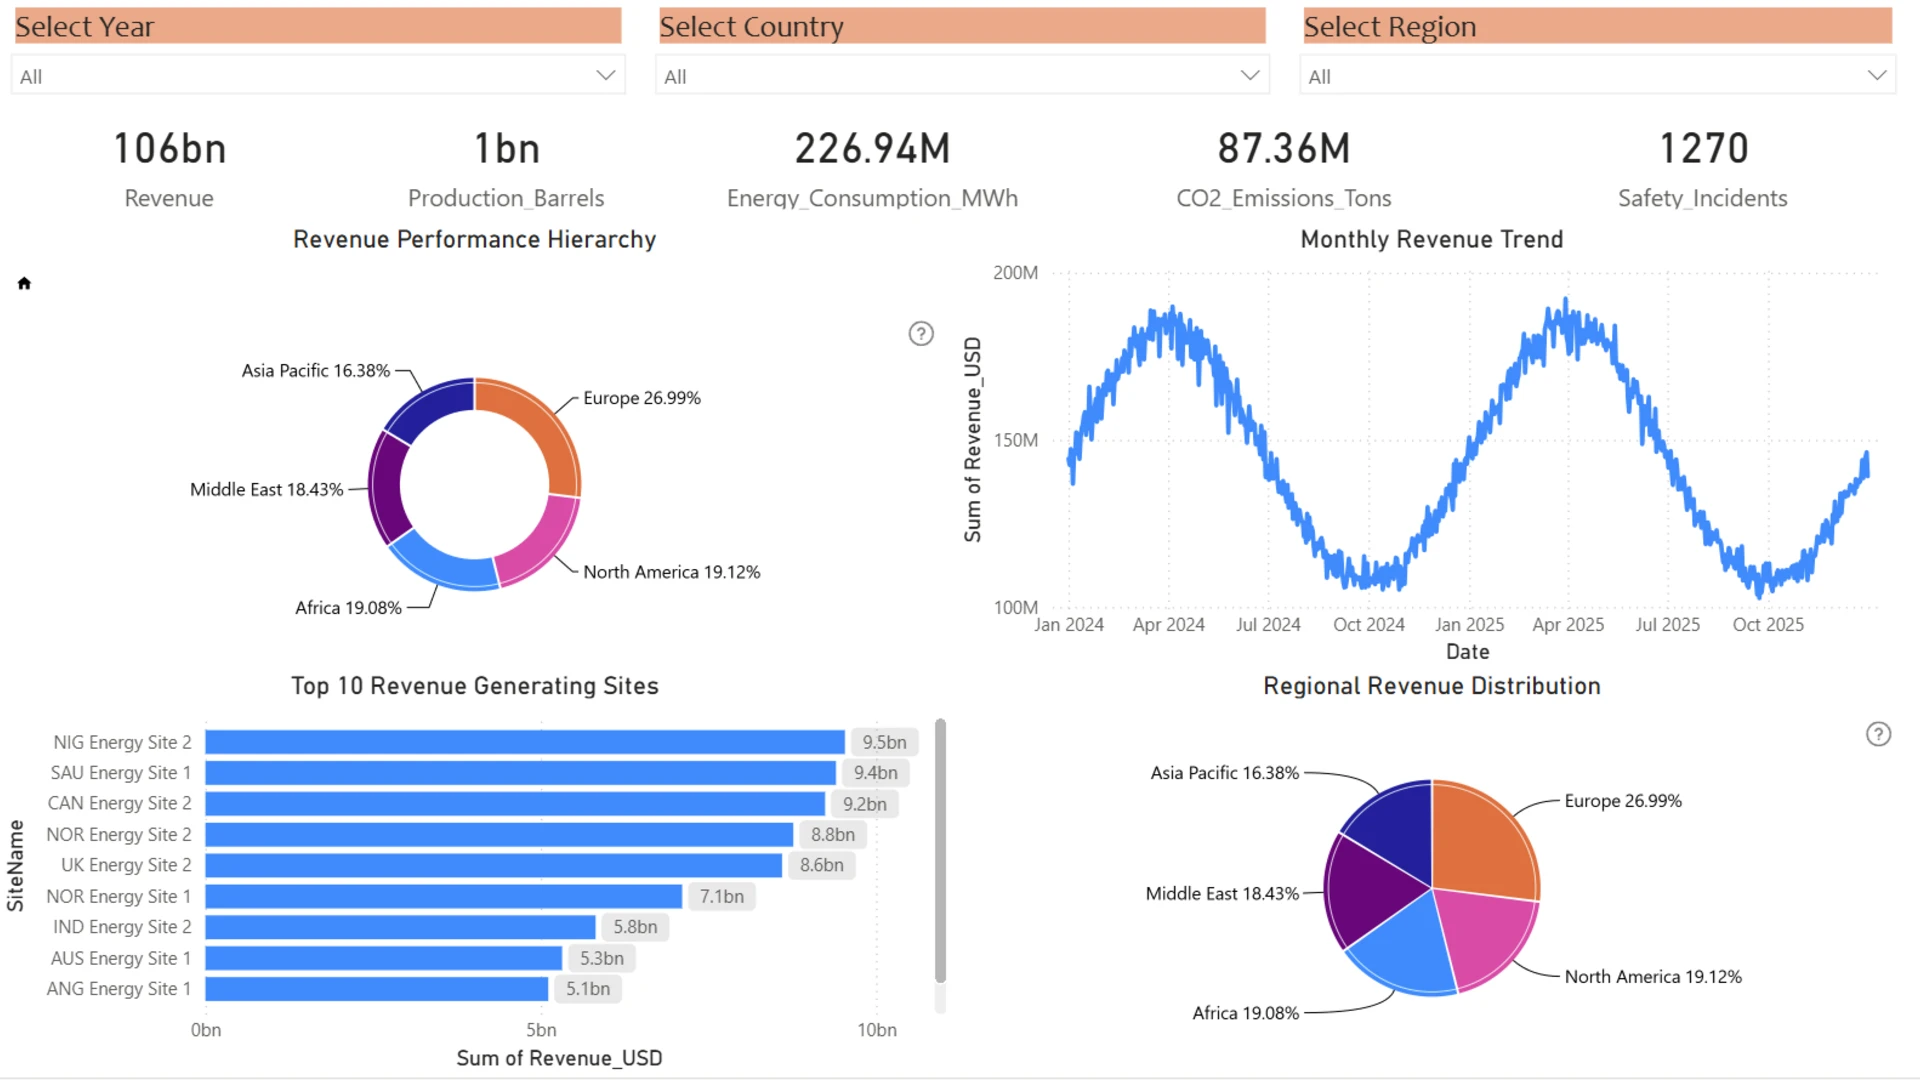
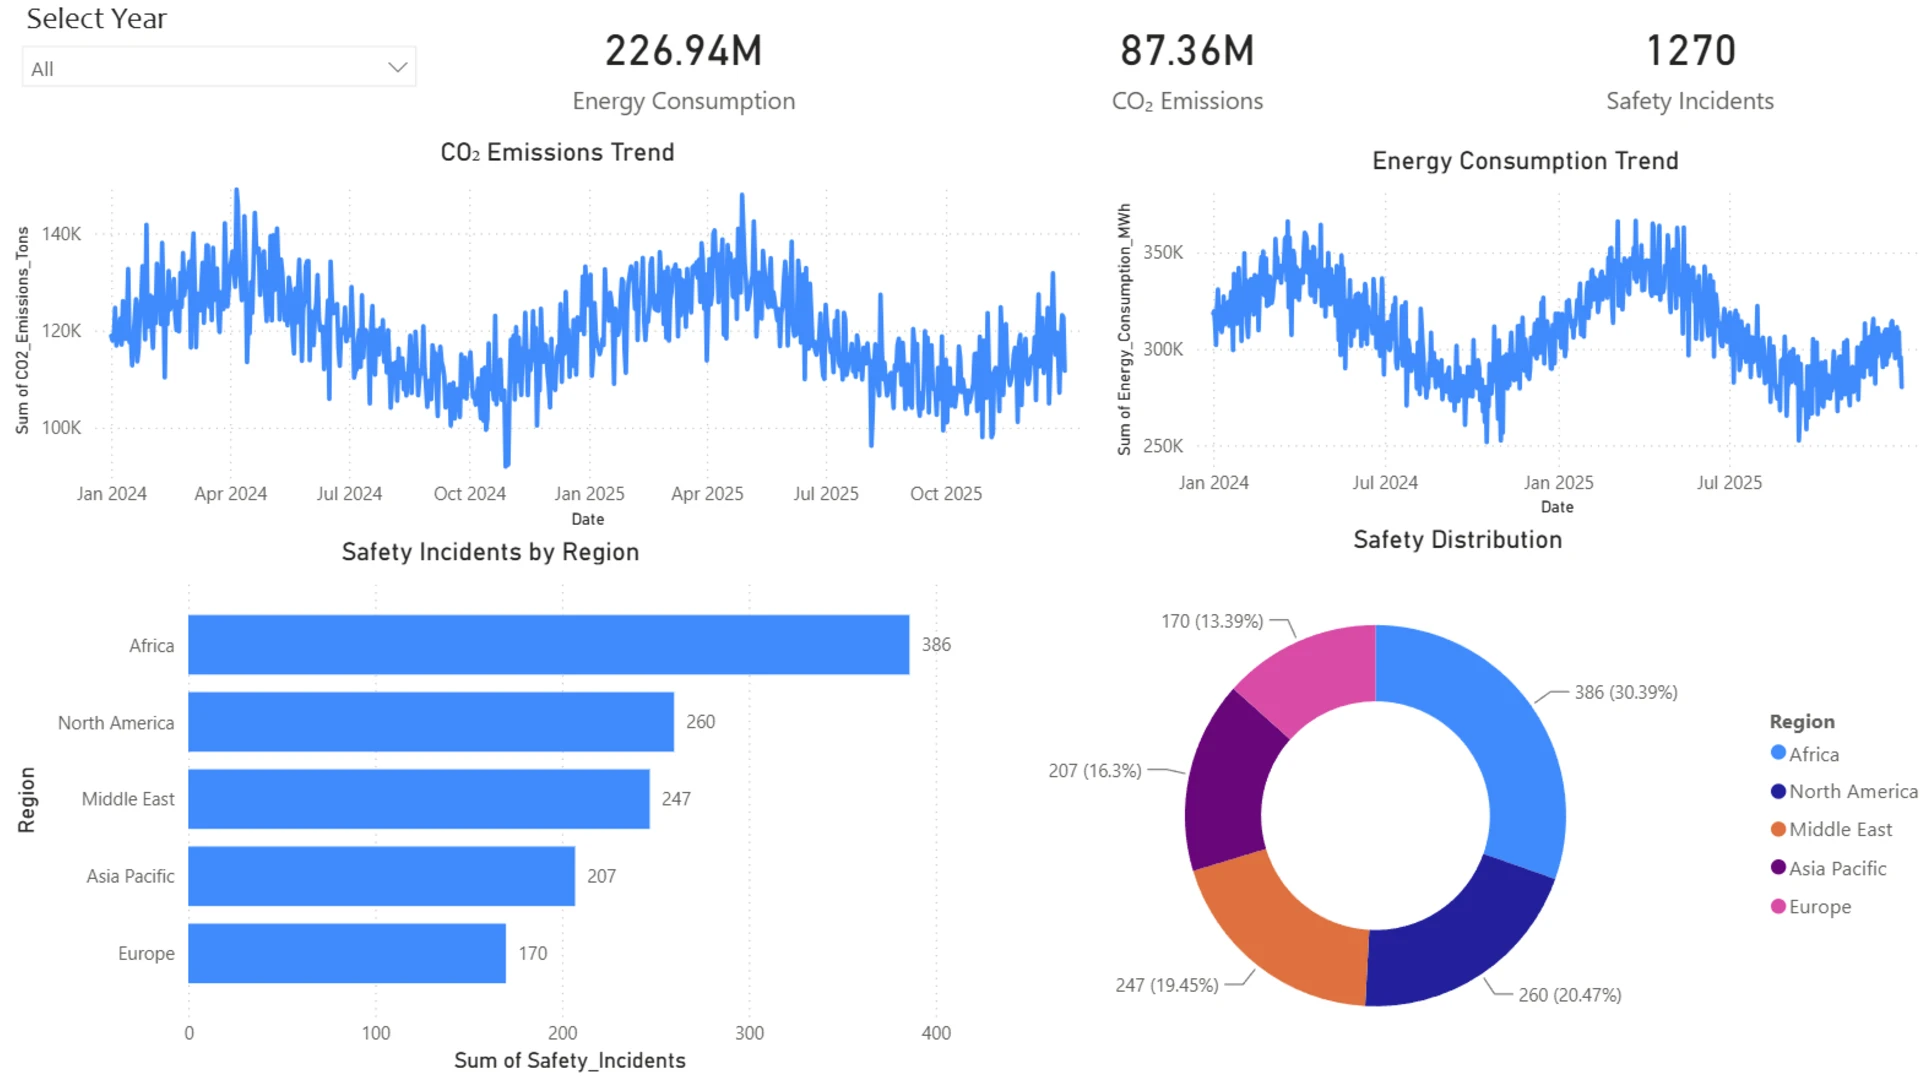
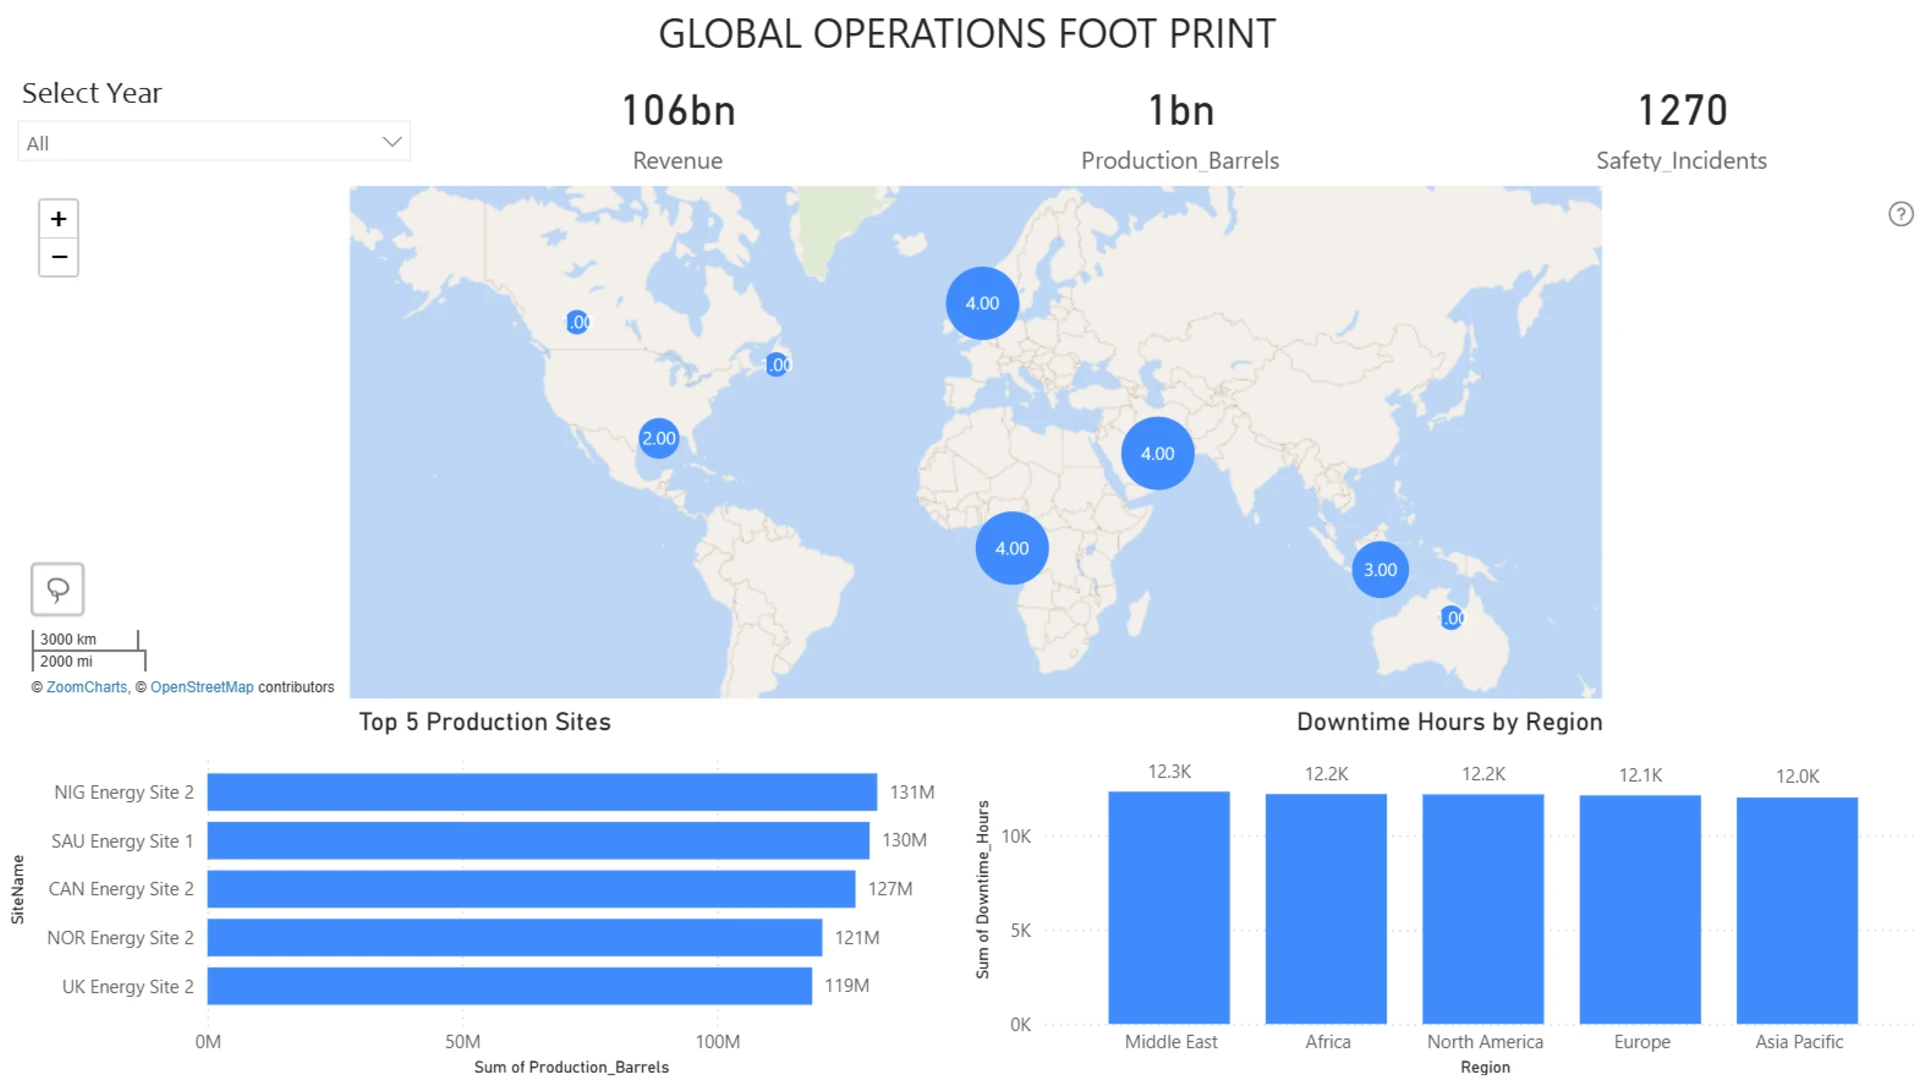
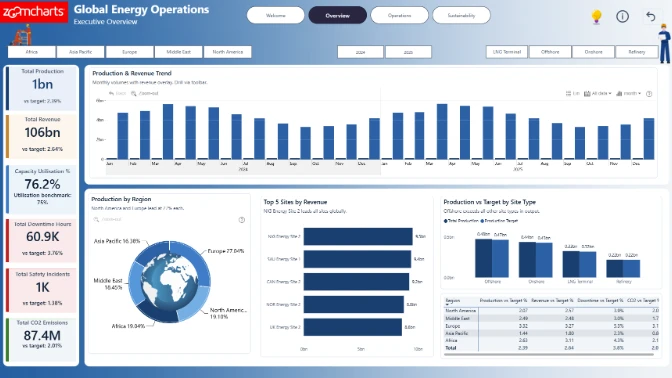
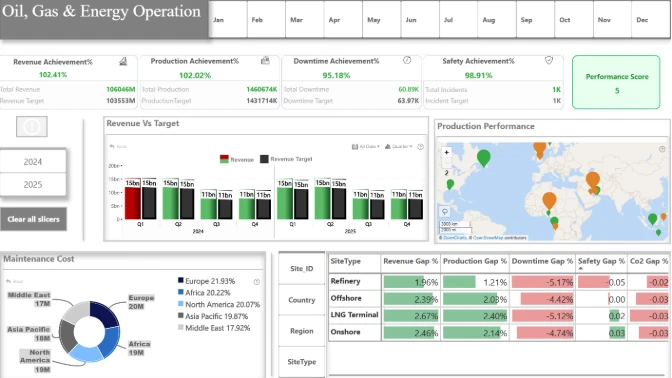
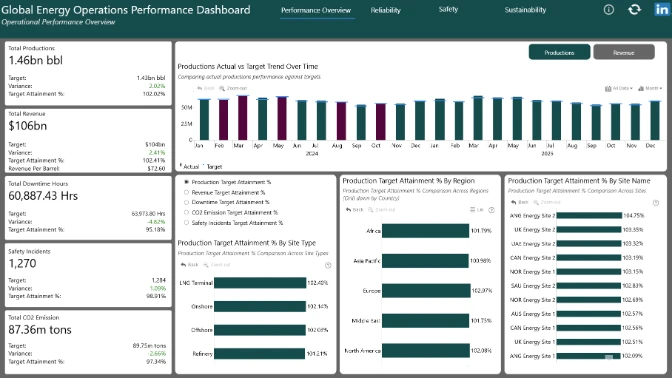
This interactive Power BI dashboard provides insights into global oil and gas operations through Executive Overview, Operations Analysis, and Sustainability & Safety Analysis. It incorporates ZoomCharts Drill Down visuals to enable interactive exploration of revenue distribution, operational performance, and geographical insights. The dashboard supports data-driven decision-making through dynamic filtering and drill-down capabilities.
This report was created for the ZoomCharts 4U Report Challenge June 2026 using Global Oil & Gas Energy Operations dataset, where Power BI developers showcase their data visualization expertise by solving real-world business use cases using native Power BI visuals together with ZoomCharts Drill Down Visuals.
4U Report Challenges
Participate in data challenges, build and submit reports to get free template downloads.
Join CommunityMobile view allows you to interact with the report. To Download the template please switch to desktop view.
Was this helpful? Thank you for your feedback!
Sorry about that.
How can we improve it?