1083
National Fuel Market Analysis 2016-2023 - Argentina
National Fuel Market Analysis 2016-2023 - Argentina

More Report pages
Report Author: Raaz Iglesias
1083
Share template with others
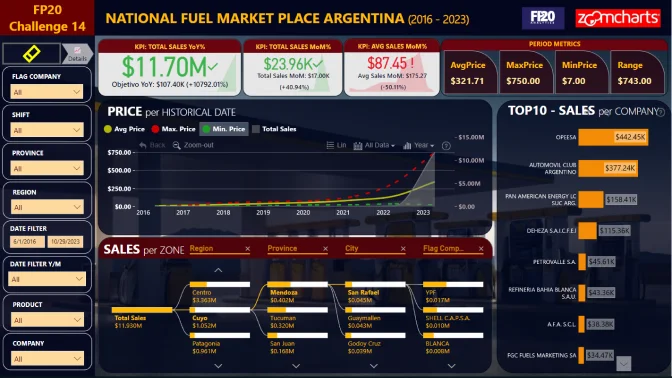
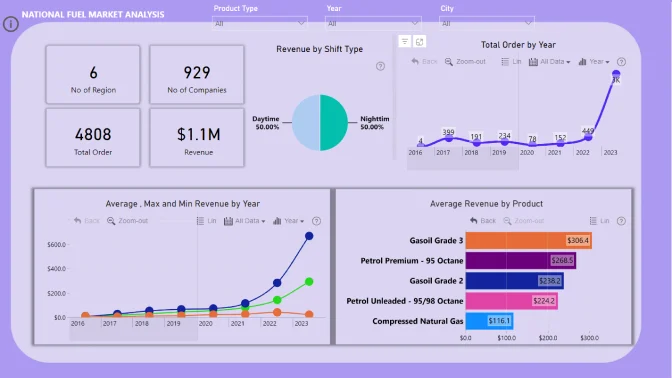
Report submitted for FP20 Analytics ZoomCharts Challenge 14 (March 2024). The report was built with the National Fuel Market Analysis dataset and includes ZoomCharts custom Drill Down PRO visuals for Power BI.
Author's description:
💡 Key insight:
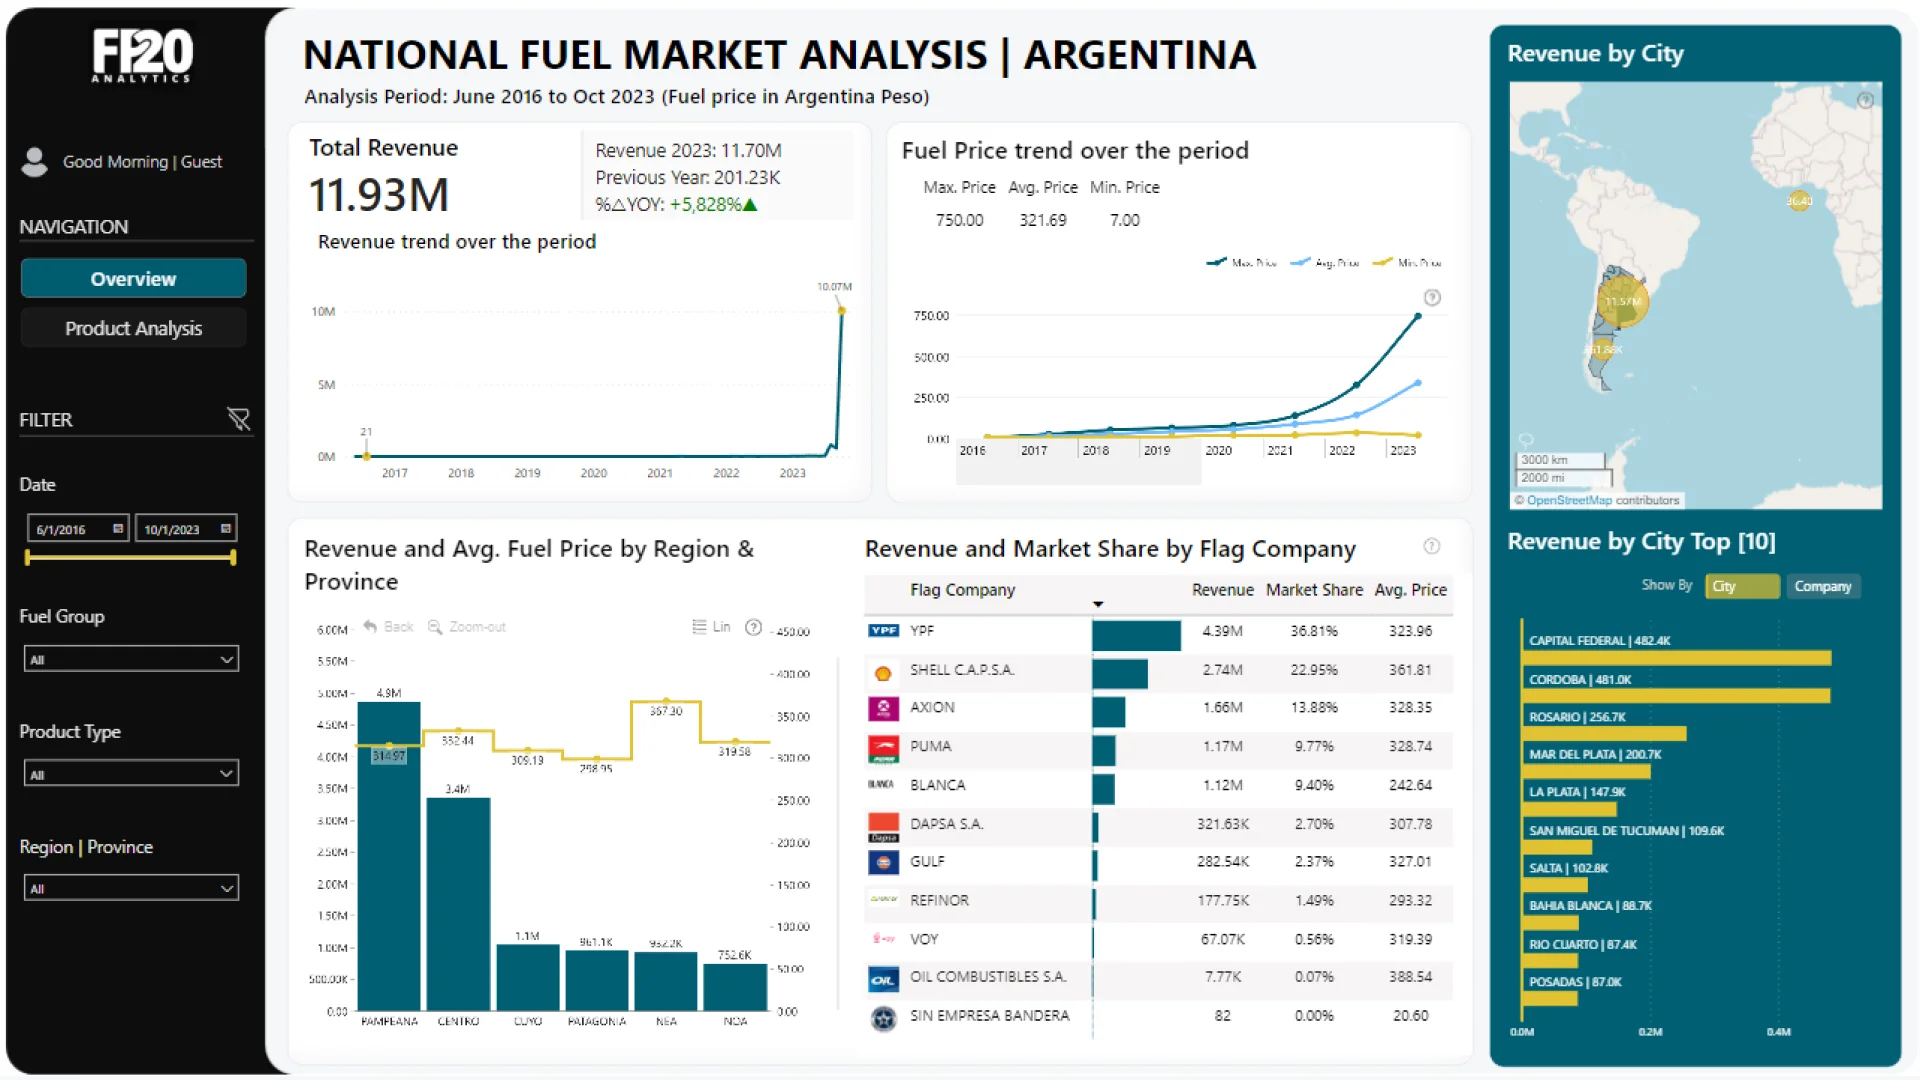
🌟 The total revenue from 2016 to 2023 in Argentina is 11.93M
🌟 Flag Company - YPF has the highest revenue with $4.39M which is 36.81% of the total market share, followed by Shell 2.74M (22.95% market share) & Axion 1.66M (13.88% market share)
🌟 Fuel prices relatively increase from time to time.
🌟 Min fuel price - 7, Max fuel price - 750, Avg. fuel price - 321.69
🌟 There are no significant changes in fuel prices between day and night shifts
🌟 Region - PAMPEANA has the highest revenue 4.9M with avg. fuel price of 314.97, followed by CENTRO 3.4M (Avg. fuel price of 332.44), CUYO 1.1M (Avg. fuel price of 309.19)
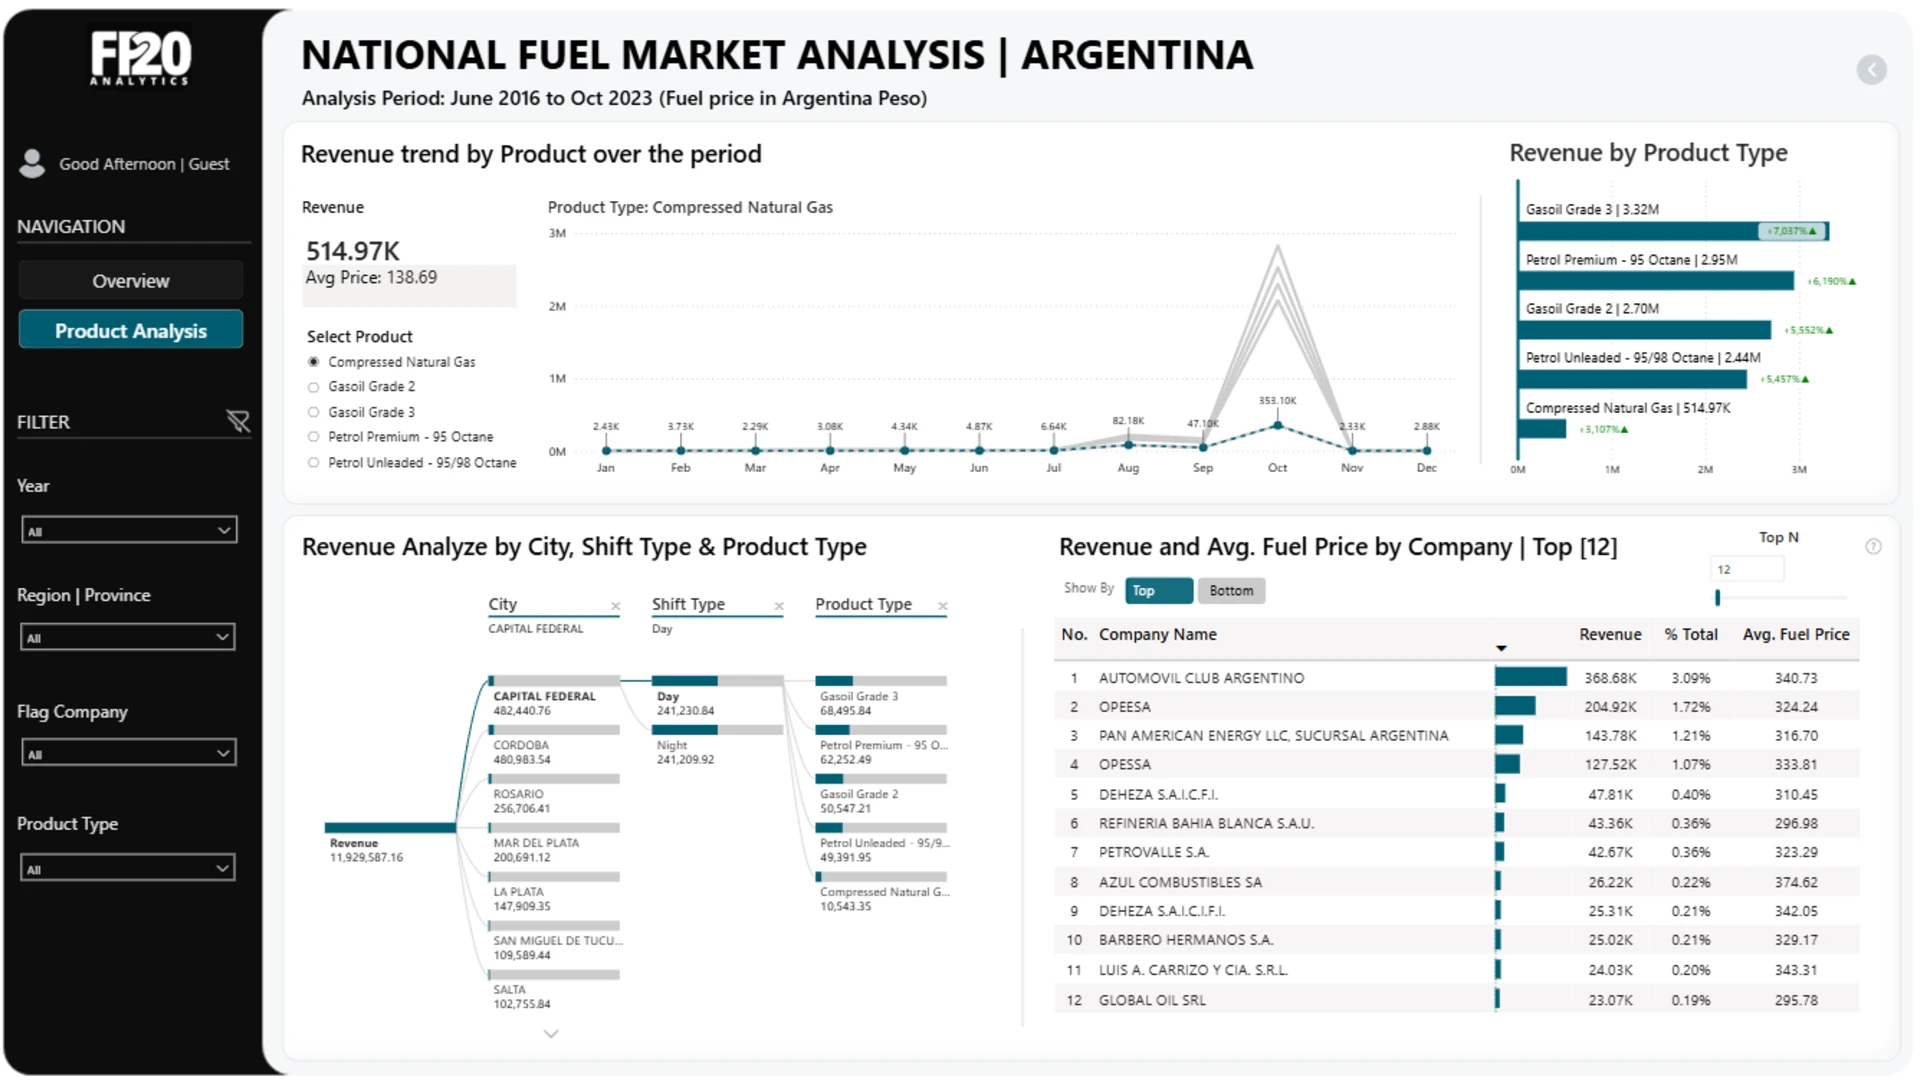
🌟 Product type - Gasoil has the highest revenue 3.32M, followed by Petrol Premium - 95 Octane has 2.95M & Gasoil grade 2 has 2.70M.
🌟 Company Name - AUTOMOVIL CLUB ARGENTION has the highest revenue 368.68K with 3.09% of the total revenue, followed by OPEESA revenue - 204.92K & PAN AMERICAN ENERGY LLC revenue - 143.78K



4U Report Challenges
Participate in data challenges, build and submit reports to get free template downloads.
Join CommunityMobile view allows you to interact with the report. To Download the template please switch to desktop view.
How to use a PBIX template
Preview the interactive report, download the PBIX file, open it in Power BI Desktop, and replace the same data connection with your own dataset.
Preview and download
Explore the report online and download the PBIX template file.
Open in Power BI Desktop
Open the downloaded PBIX file in Power BI Desktop.
Connect your data
Replace the sample data source with your own dataset.
Refresh and adjust
Refresh the model and update fields or visual were needed.
Save and share
Save your report and publish it for your audience.


