757
Argentina National Fuel Market Analysis 3
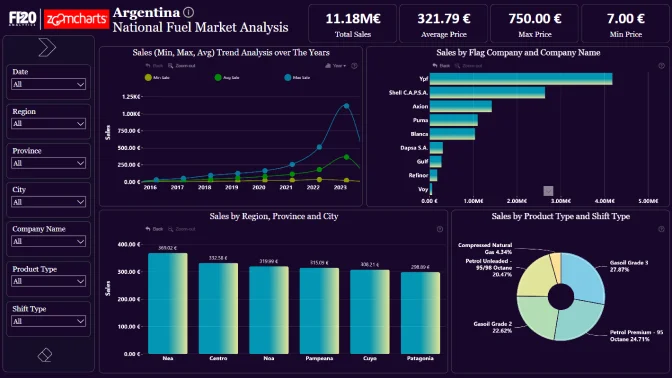
Argentina National Fuel Market Analysis 3
More Report pages
Report Author: Saddam Ansari
757
Share template with others
Report submitted for FP20 Analytics ZoomCharts Challenge 14 (March 2024). The report was built with the National Fuel Market Analysis dataset and includes ZoomCharts custom Drill Down PRO visuals for Power BI.
Author's description:
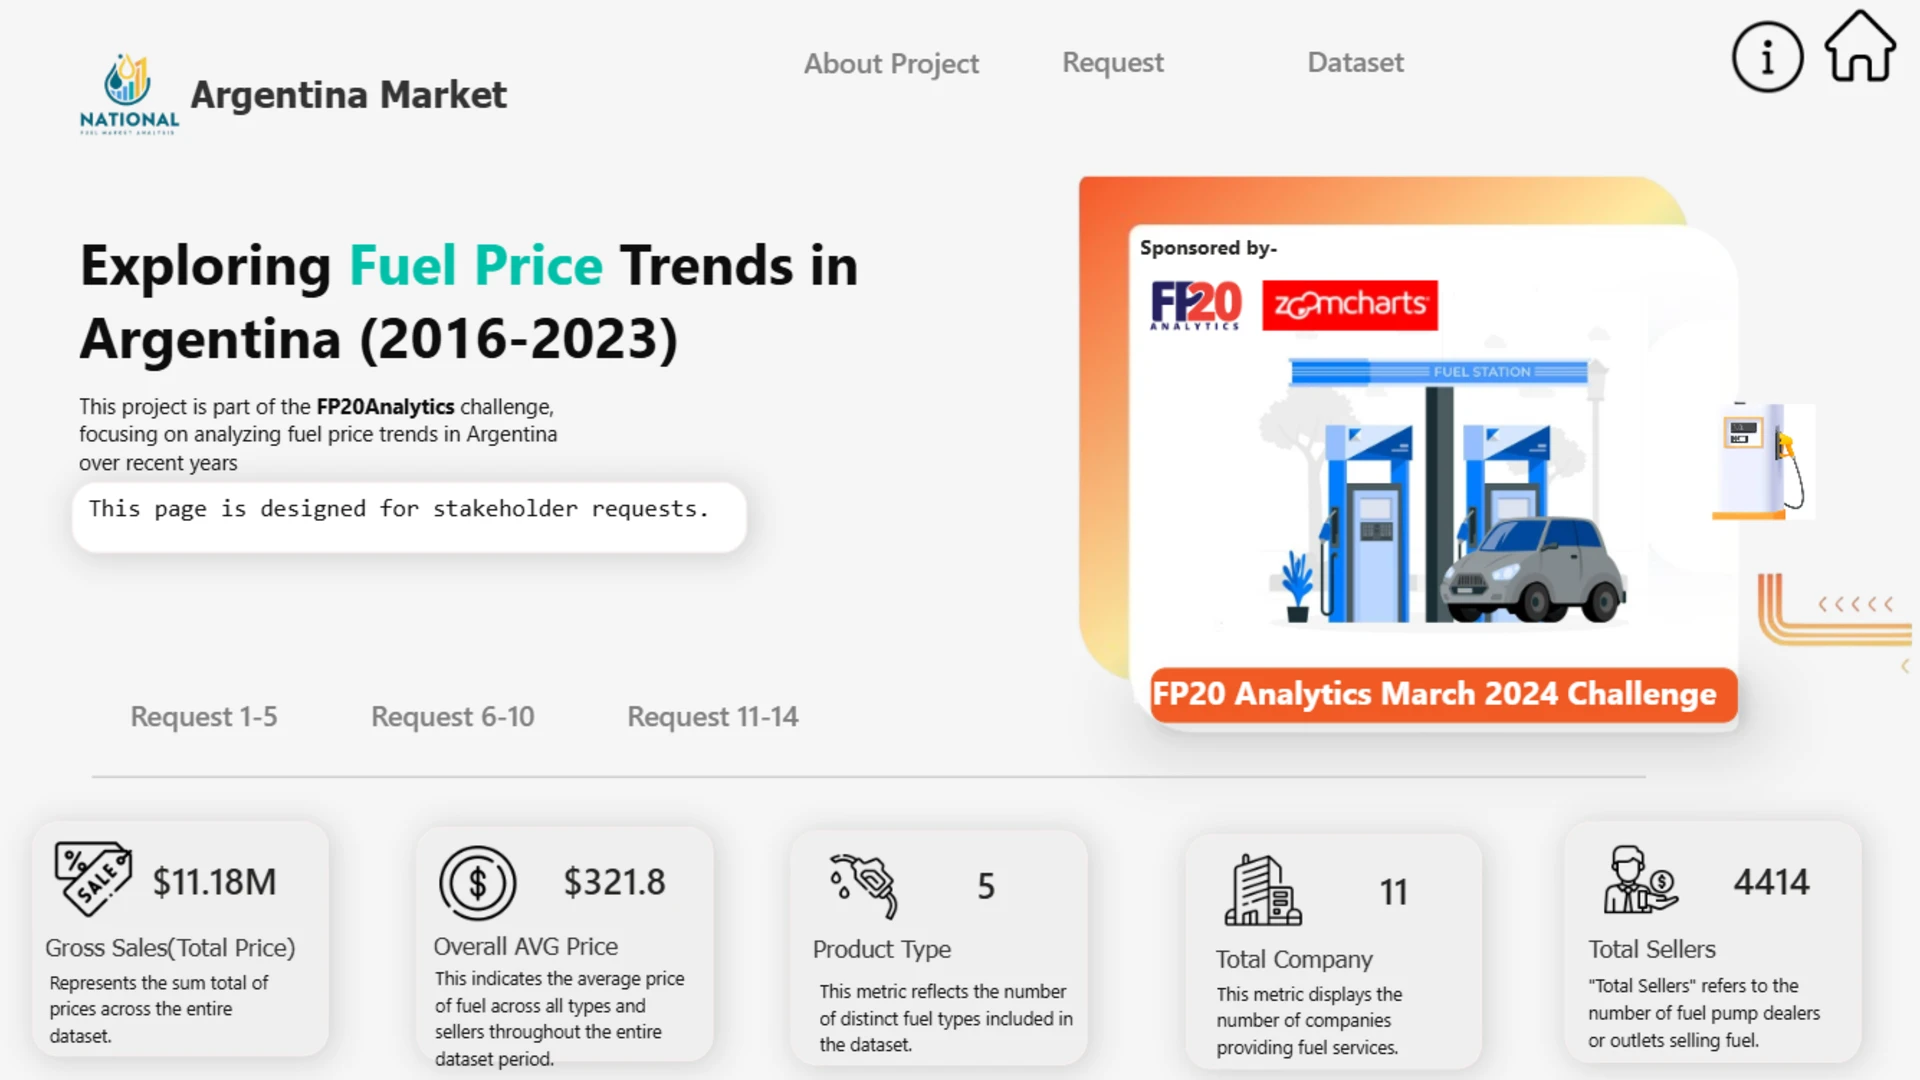
My submission of, The FP20 Analytics March 2024 Challenge was a data analysis project designed to investigate the trends and fluctuations of fuel prices across Argentina during the last few years. The challenge was sponsored by FP20 Analytics and ZoomCharts. The report consisted of two pages: 1. Home Page 2. Insights Page
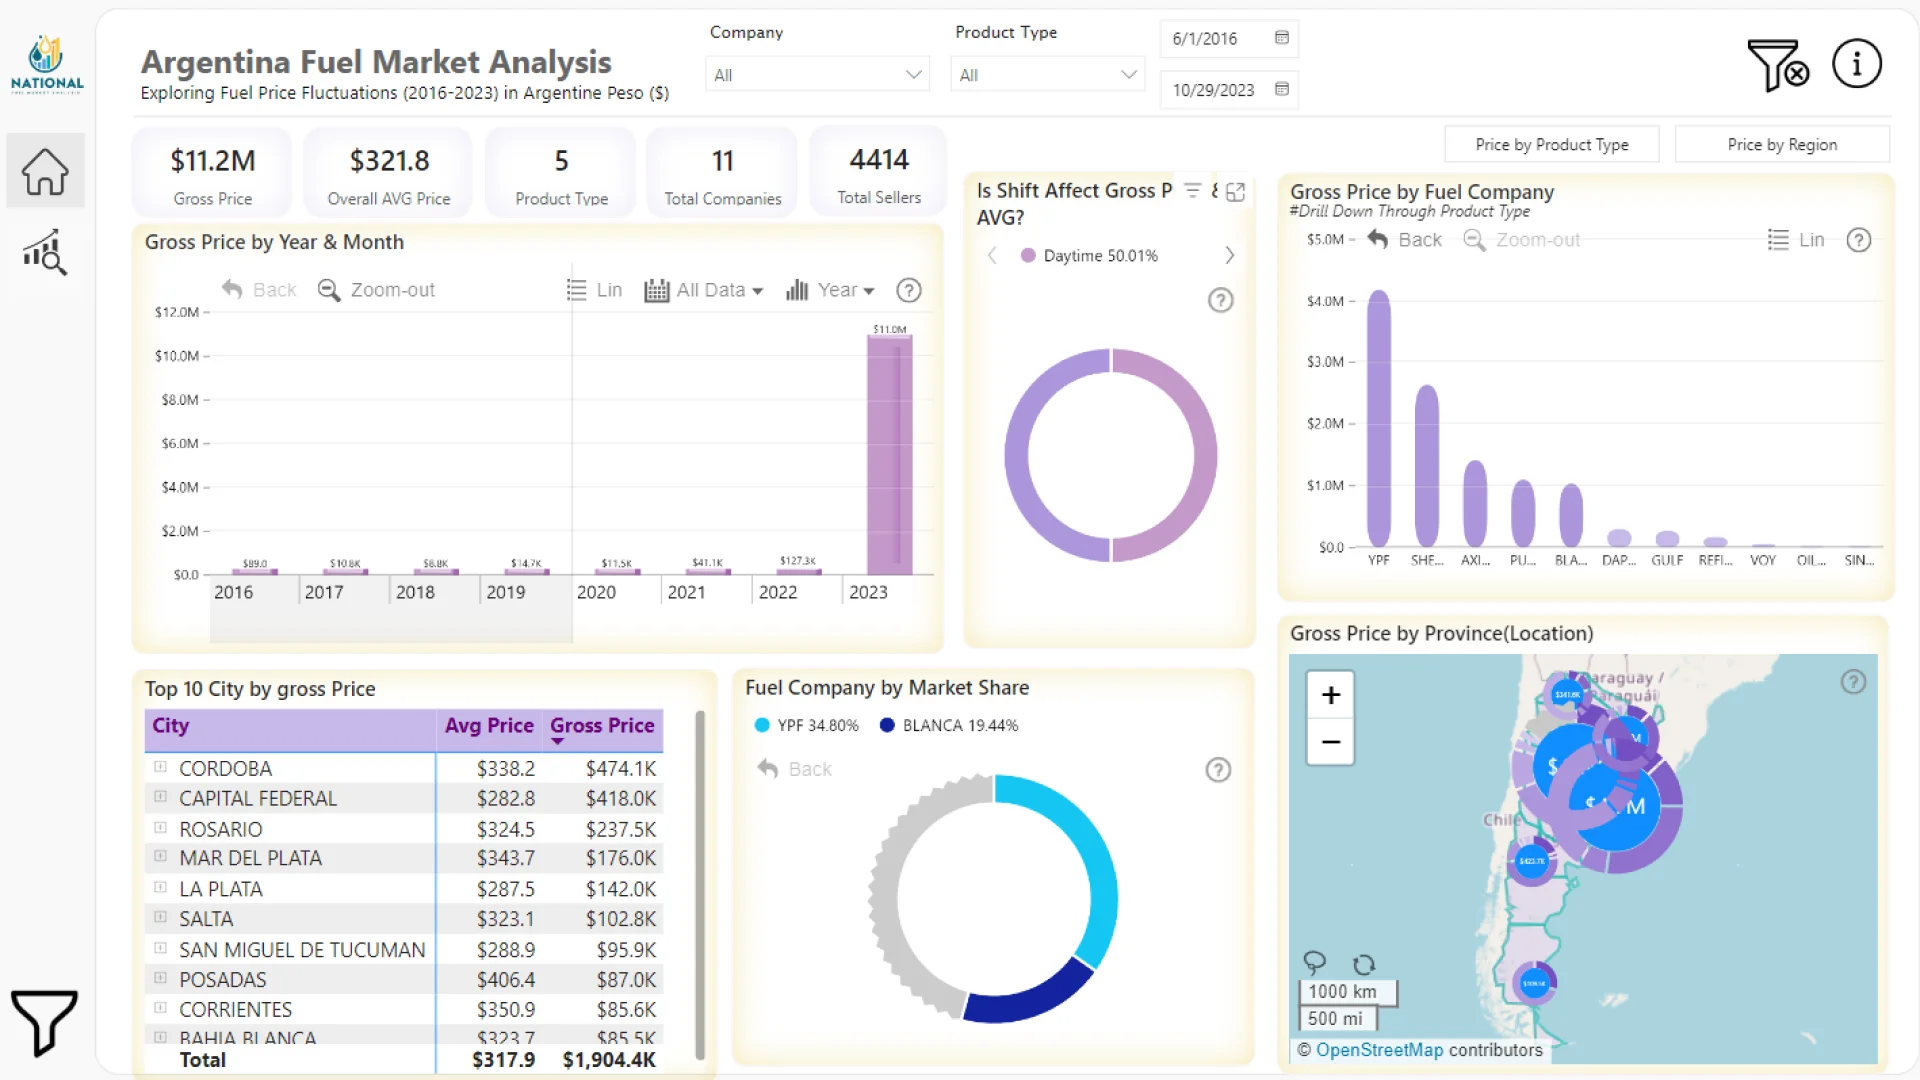
𝗛𝗼𝗺𝗲 𝗣𝗮𝗴𝗲: The Home page serves as the gateway to the dashboard, offering an overview of key insights. It features interactive slicers and filters for user customization, allowing stakeholders to explore data based on their preferences. Key performance indicators (KPIs) such as gross sales, overall sales, product types, total companies, and total sellers provide a snapshot of the fuel market. A trendline chart illustrates gross sales by year, with drill-down capabilities to view monthly trends. A donut chart showcases sales by shift type to discern the impact of day and night shifts. Sales by fuel company are visualized in another donut chart, facilitating drill-down analysis by product type and region. Additionally, a table displays top 10 cities by sales and average price, offering insights into regional dynamics. A donut chart depicting fuel company market share aids in understanding market dominance. Lastly, a map visualizes sales by province, with values distributed based on company representation.
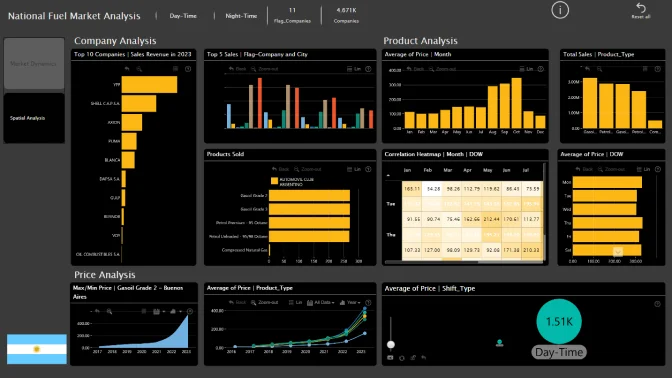
𝗜𝗻𝘀𝗶𝗴𝗵𝘁𝘀 𝗣𝗮𝗴𝗲: The Insights page serves as the heart of the dashboard, presenting visually appealing insights with detailed explanations for stakeholders. It provides stakeholders with a user-friendly and easy-to-understand view of the data, enabling them to gain valuable insights effortlessly. I would like to express my sincere gratitude to FP20 Analytics and ZoomChart for sponsoring this challenge, which has been an immensely enriching journey for me. Such initiatives not only enhance skills but also strengthen portfolios through real-world projects. Special thanks to Aivis Pavlovs from ZoomCharts for his invaluable guidance and support throughout the project.
ZoomCharts visuals used
4U Report Challenges
Participate in data challenges, build and submit reports to get free template downloads.
Join CommunityMobile view allows you to interact with the report. To Download the template please switch to desktop view.
Was this helpful? Thank you for your feedback!
Sorry about that.
How can we improve it?