711
National Fuel Market Analysis 2
National Fuel Market Analysis 2
More Report pages
Report Author: Zakaria Fadili
711
Share template with others
Report submitted for FP20 Analytics ZoomCharts Challenge 14 (March 2024). The report was built with the National Fuel Market Analysis dataset and includes ZoomCharts custom Drill Down PRO visuals for Power BI.
Author's description:
Here's my my submission for the FP20 Analytics Data Challenge 14 on ZoomCharts!
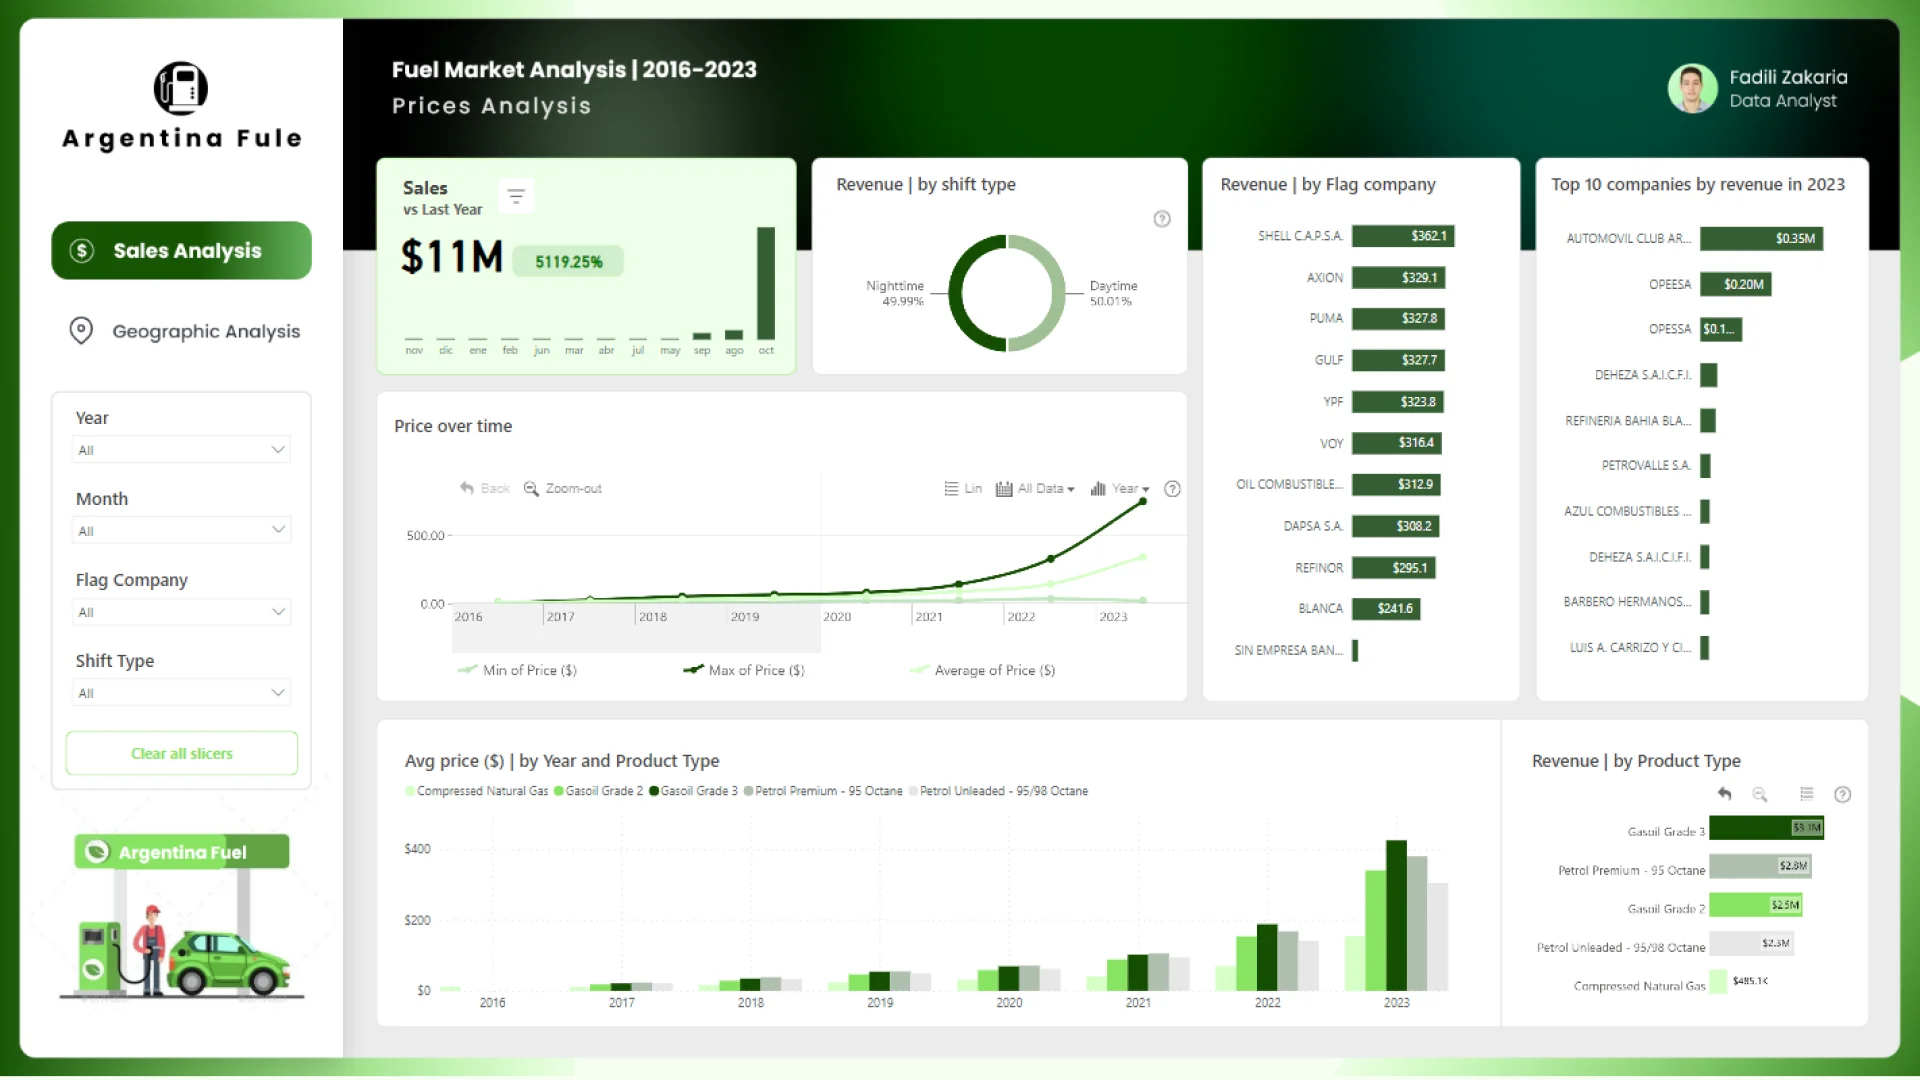
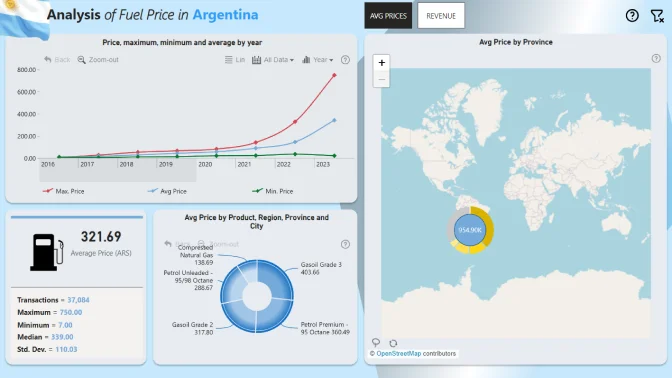
📊 Explore Argentina's fuel market prices with dynamic Power BI dashboard.
📈 The Price Analysis page offers a comprehensive snapshot of the latest trends, volatility, and seller volumes, allowing stakeholders to make informed decisions with ease.
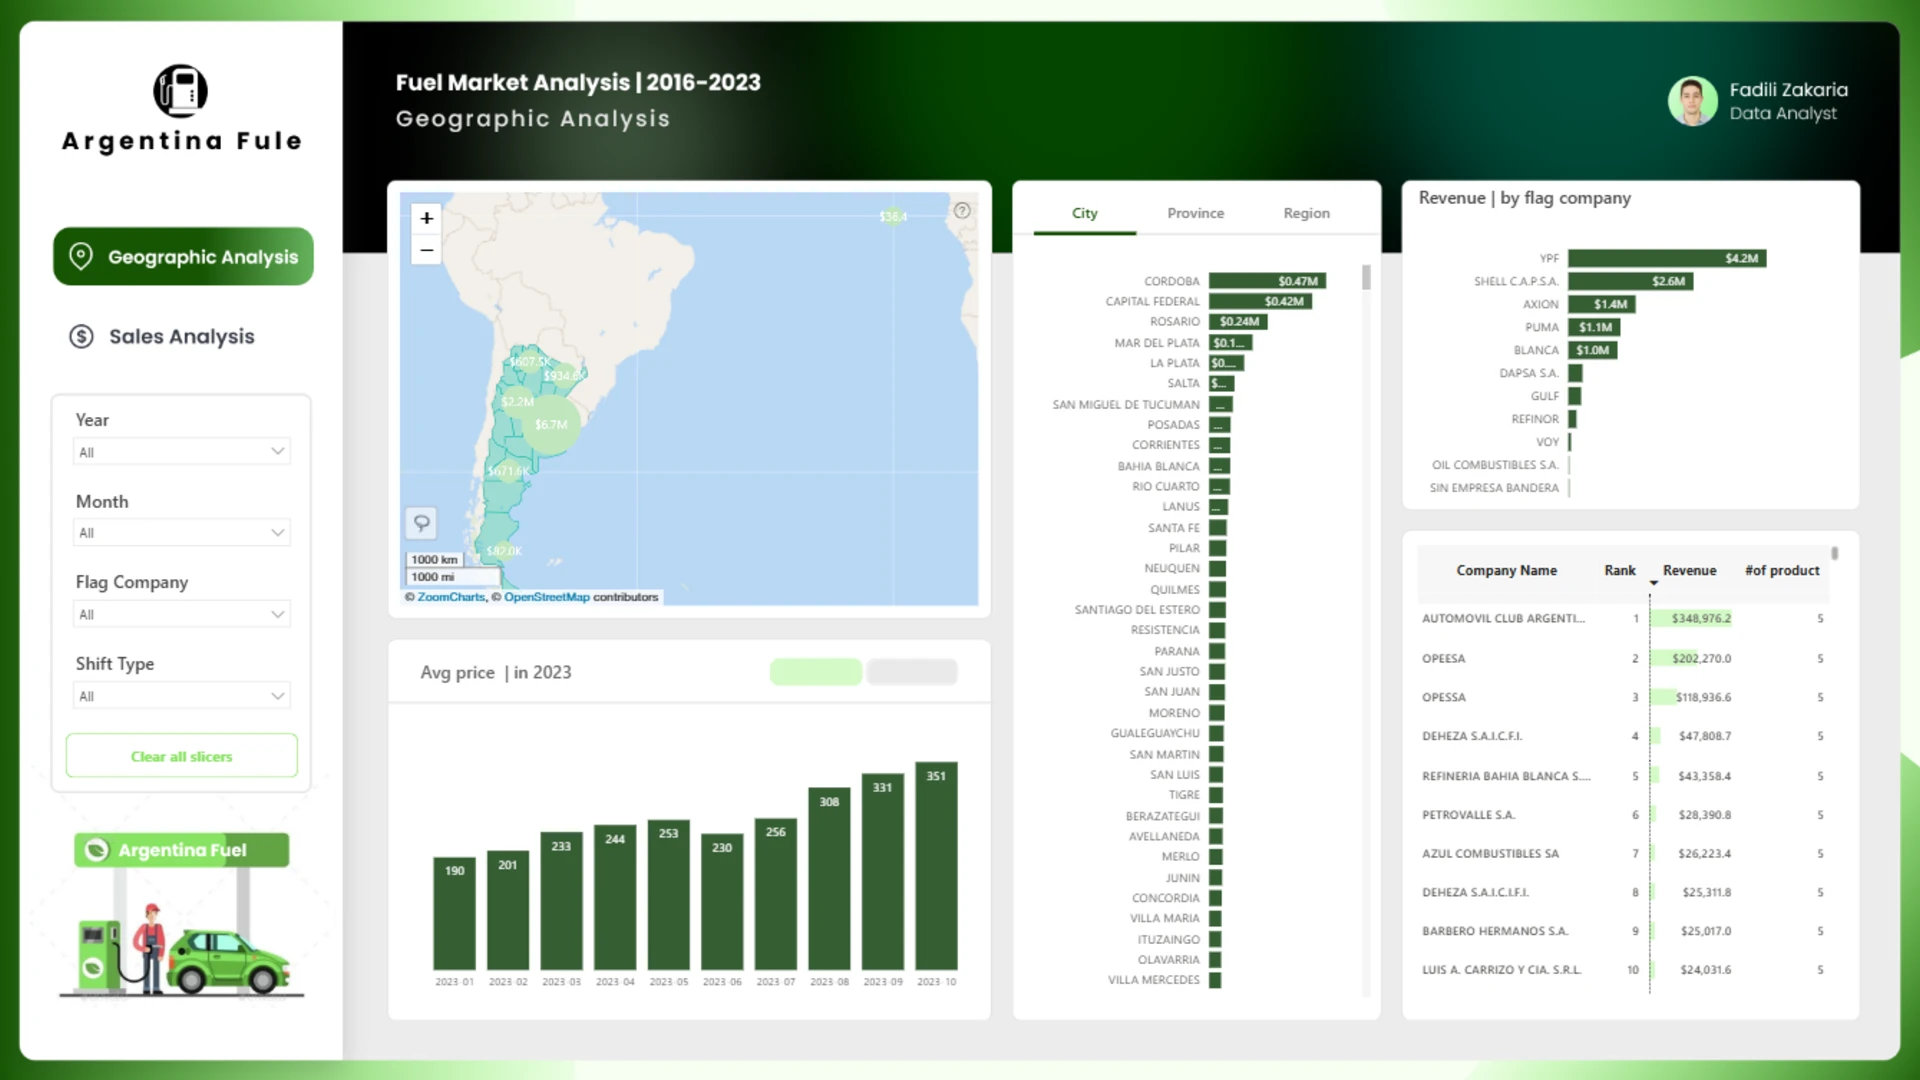
🗺️ Switch to the Geographic Analysis page to delve into regional and provincial price comparisons, uncovering market variations across Argentina. Gain valuable insights into flagged companies' dynamics and their impact on the market landscape.
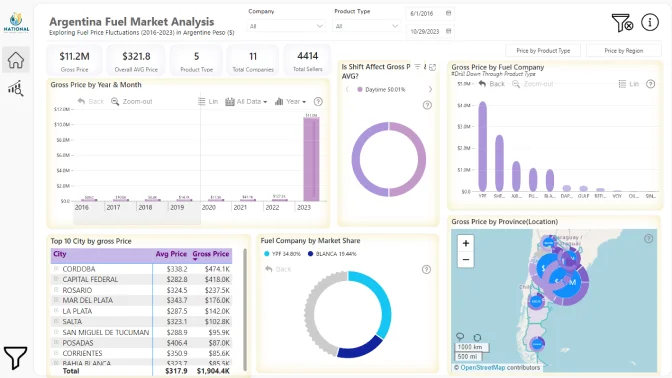
💡 Leveraging ZoomCharts Drill Down Visuals and Candlestick Charts
ZoomCharts visuals used
4U Report Challenges
Participate in data challenges, build and submit reports to get free template downloads.
Join CommunityMobile view allows you to interact with the report. To Download the template please switch to desktop view.
Was this helpful? Thank you for your feedback!
Sorry about that.
How can we improve it?