785
Movies Across Times (Top 10k)
Movies Across Times (Top 10k)
Report Author: Miikka Karava
785
Share template with others
Report submitted for Onyx Data DataDNA ZoomCharts Mini Challenge, April 2024. The report was built based on The Movie Database dataset and includes ZoomCharts custom Drill Down PRO visuals for Power BI.
Author's description:
Here is my submission on the onyx-data-april-2024# IMDb Movie Database challenge:
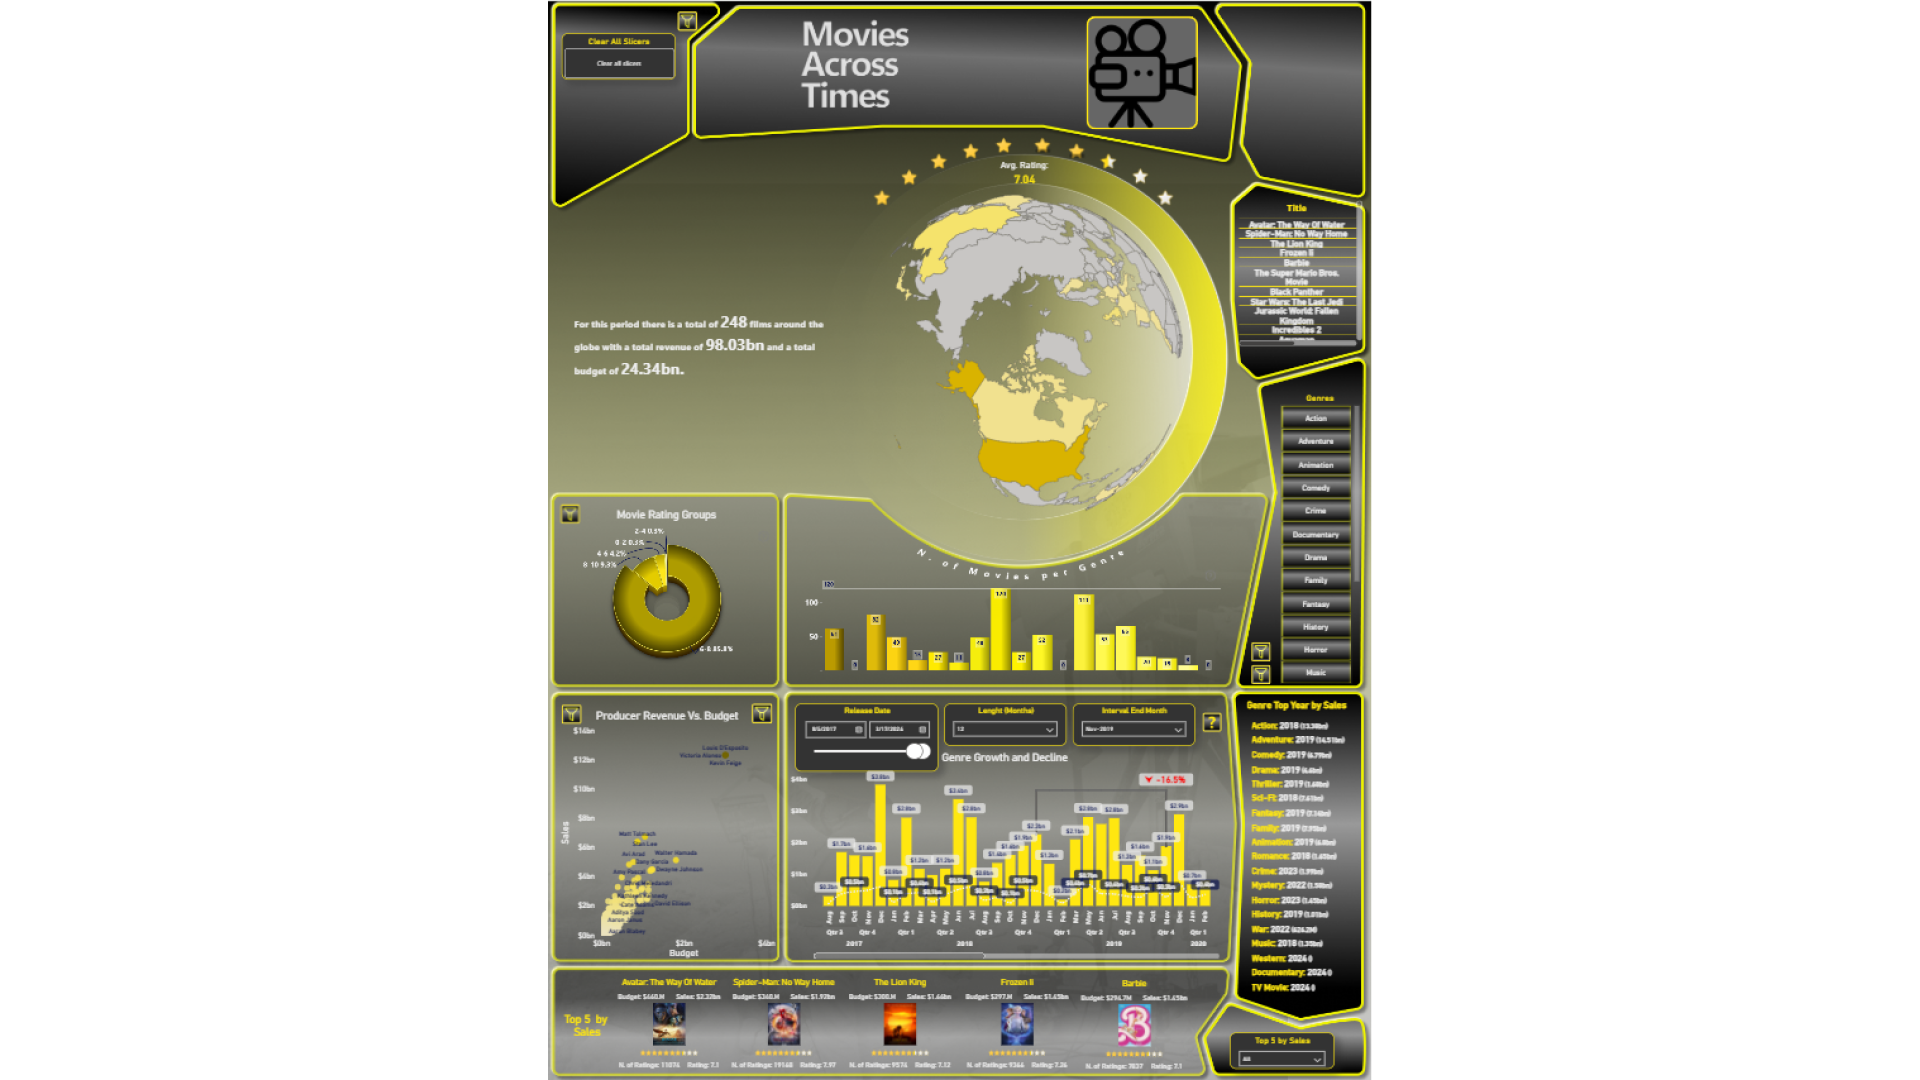
🎥 The Dashboard contains insights and visuals for top 10k movies ranked based on Total Revenue.
🗺 The top section has summarization for the selected movie(s), time period and a globe map showing where the movies were filmed.
🍩 Below on left there is a donut visual for movies by rating groups and movies by runtime. Below is a dynamic scatter plot visual which has a view for both Producers and Directors for comparisons between budget and sales.
🔻 🔺 The right section has top sales and budget comparisons for each genre and option to view growth/decline on each genre within selected time interval.
📜 The bottom section features top 5 KPI statistics for Movies, Genres as well as Producers, Directors and so on.
4U Report Challenges
Participate in data challenges, build and submit reports to get free template downloads.
Join CommunityMobile view allows you to interact with the report. To Download the template please switch to desktop view.
Was this helpful? Thank you for your feedback!
Sorry about that.
How can we improve it?