753
Merchandise Sales Dashboard 8
Merchandise Sales Dashboard 8
Report Author: Mirzan Fawas
753
Share template with others
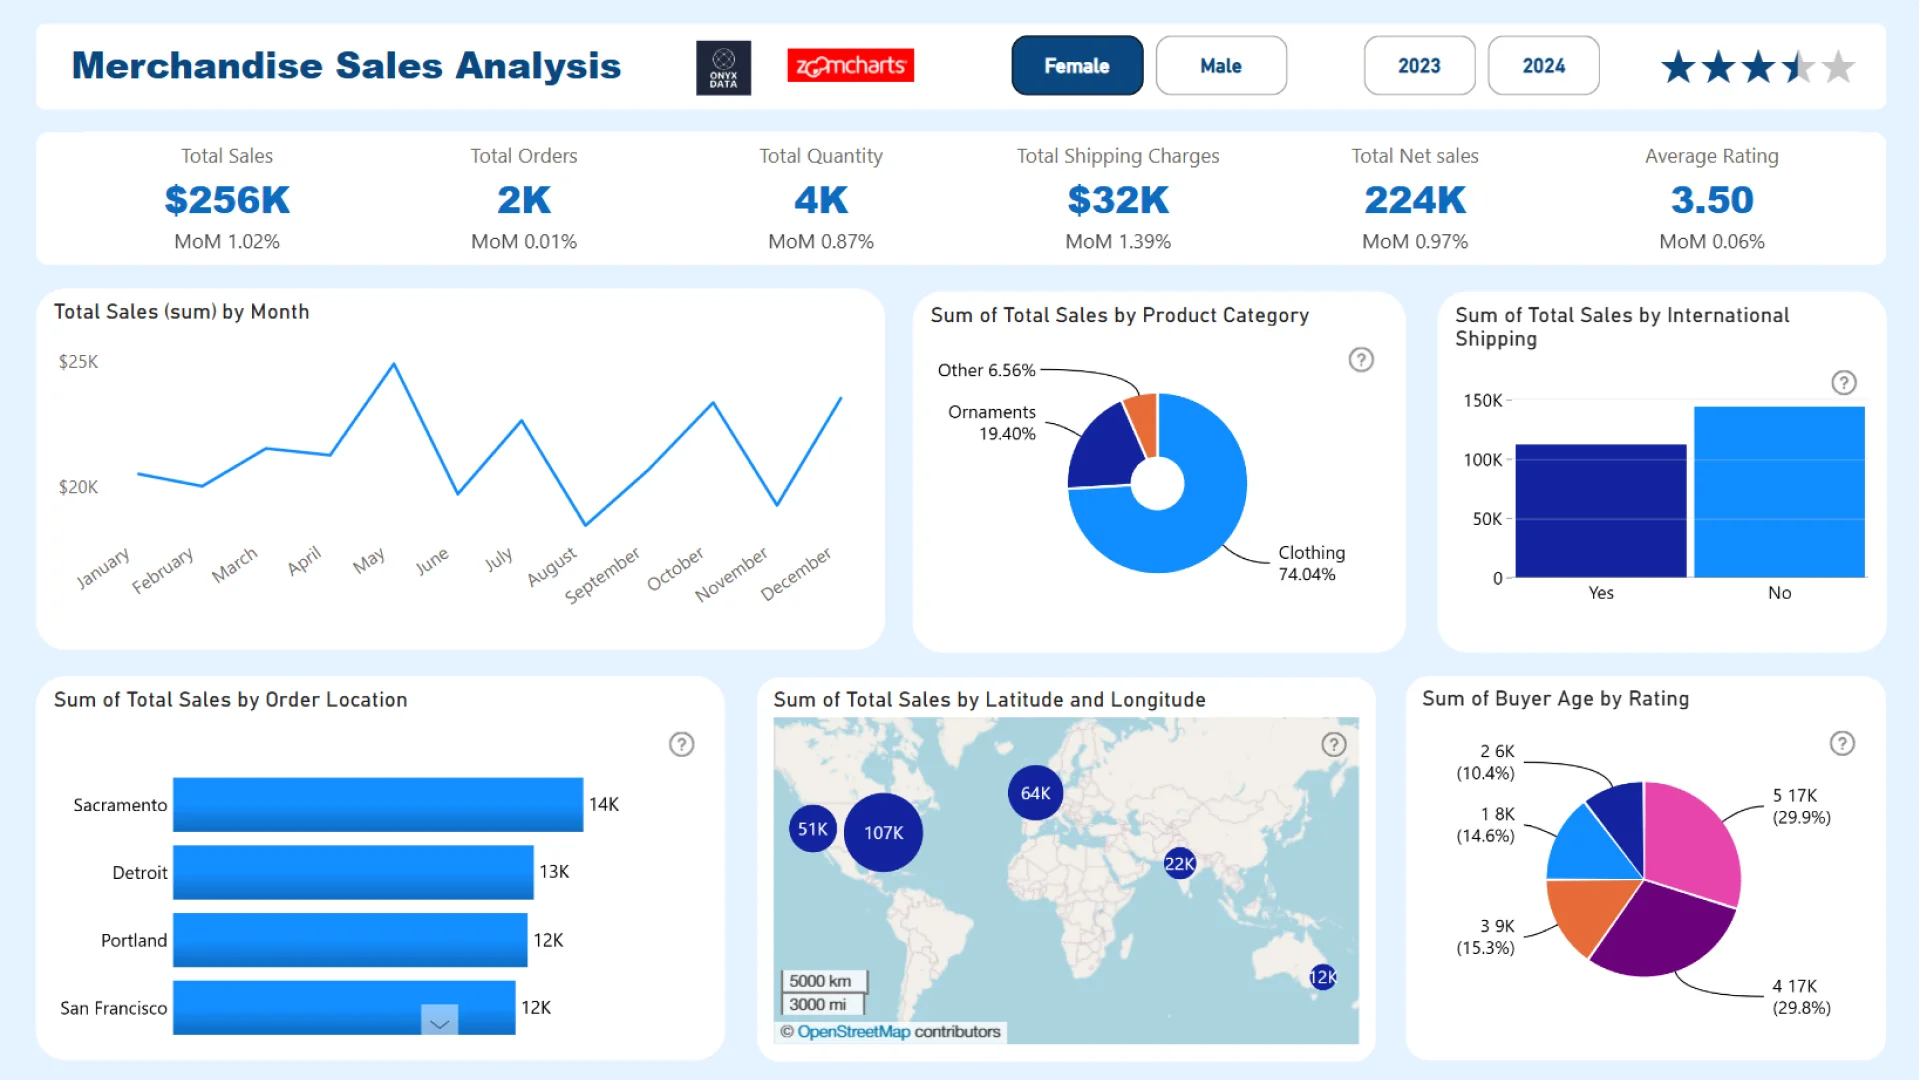
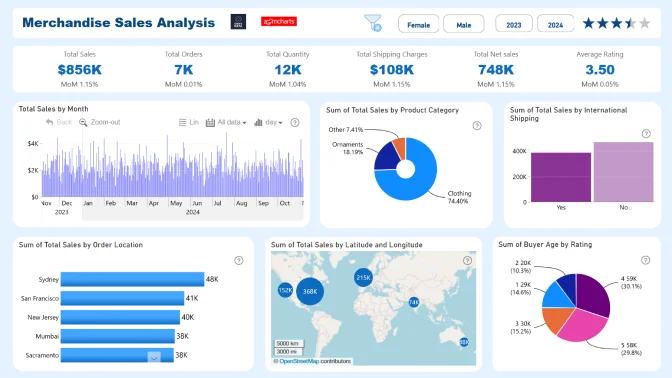
Report submitted for Onyx Data DataDNA ZoomCharts Mini Challenge, January 2025. The report is based on the Merchandise Sales dataset and includes ZoomCharts custom Drill Down PRO visuals for Power BI.
Author's description:
The Merchandise Sales Dashboard for the Onyx Data DNA Dataset Challenge (January 2025) showcases key performance metrics, including total sales, profit, top-performing product categories, and average ratings. It provides a comprehensive analysis of international and domestic sales, focusing on customer feedback and shipping performance. The dashboard highlights notable achievements like strong profit margins, significant sales contributions from the clothing category, and top sales locations, offering a clear and visually compelling representation of the dataset’s overall performance.
ZoomCharts visuals used
4U Report Challenges
Participate in data challenges, build and submit reports to get free template downloads.
Join CommunityMobile view allows you to interact with the report. To Download the template please switch to desktop view.
Was this helpful? Thank you for your feedback!
Sorry about that.
How can we improve it?