782
E-Commerce Analysis 4
E-Commerce Analysis 4
Report Author: Adaobi Roseline Ezechukwu
782
Share template with others
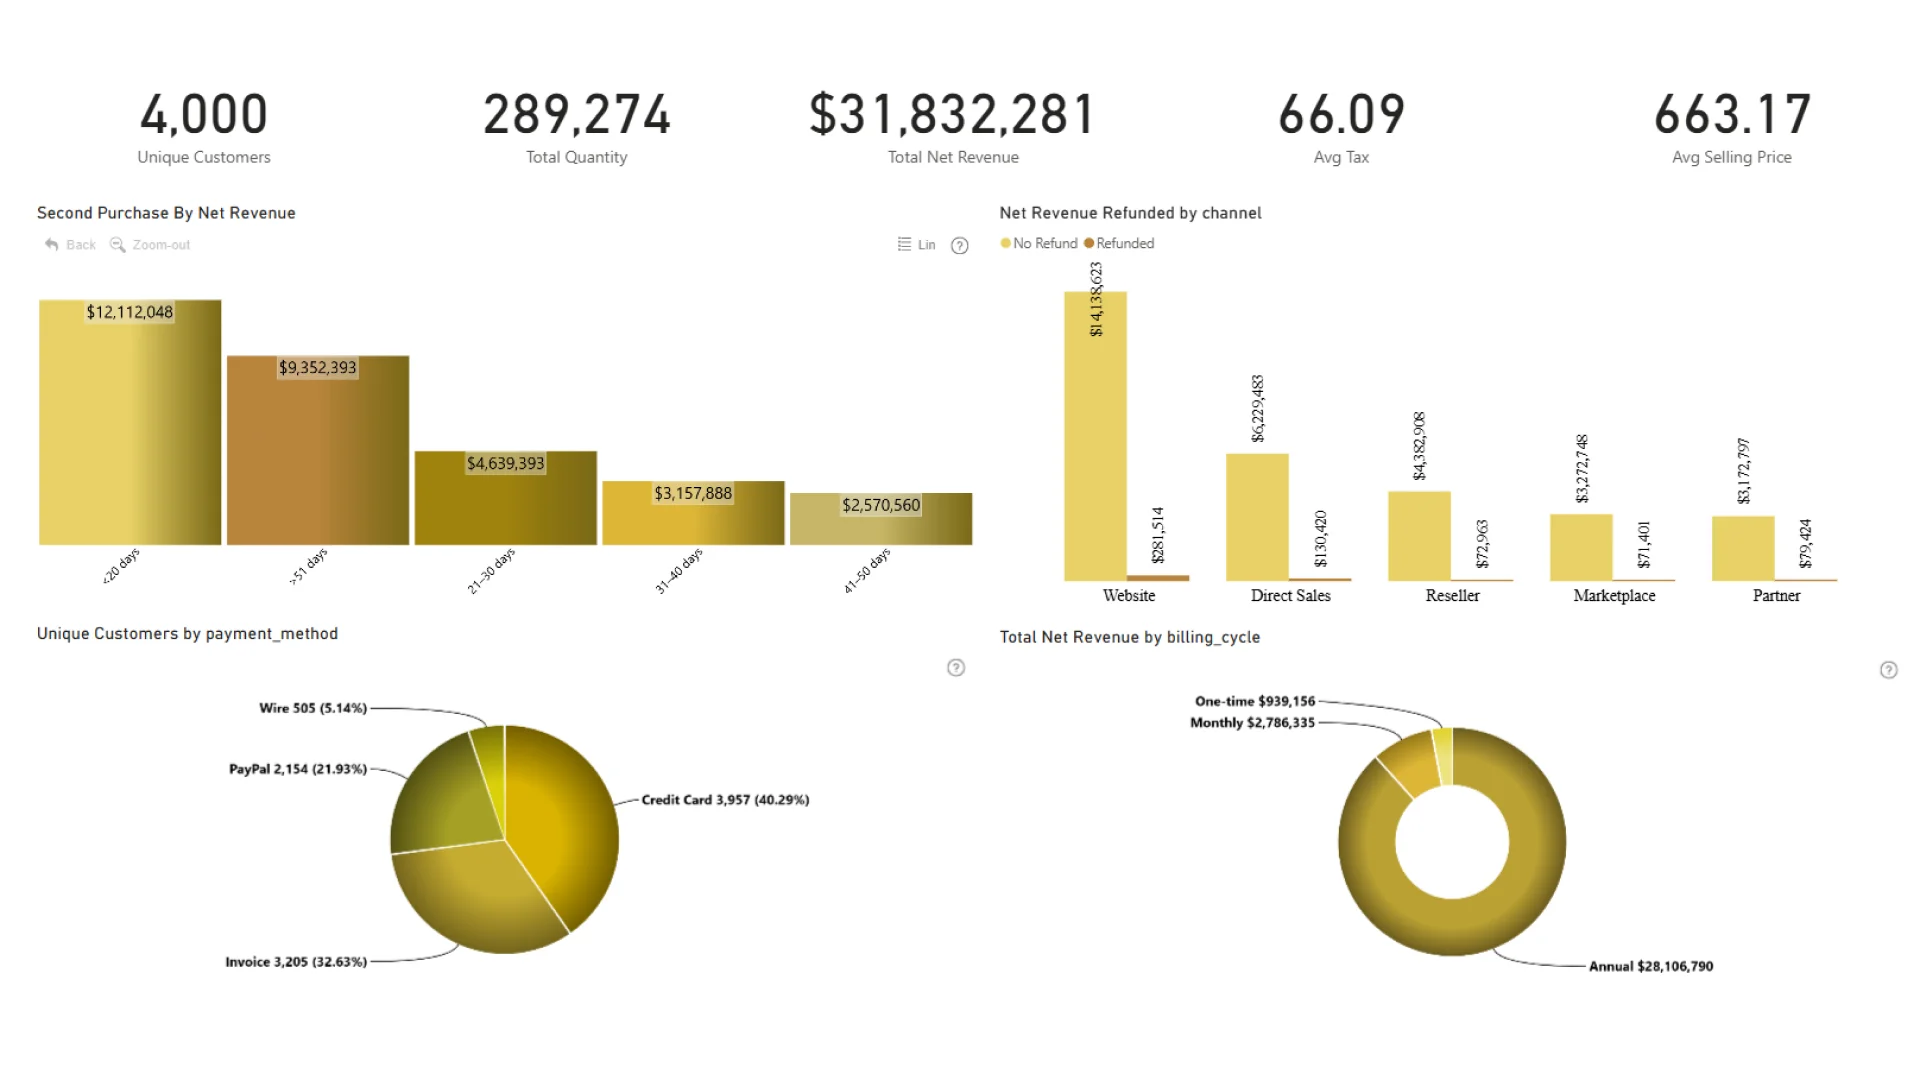
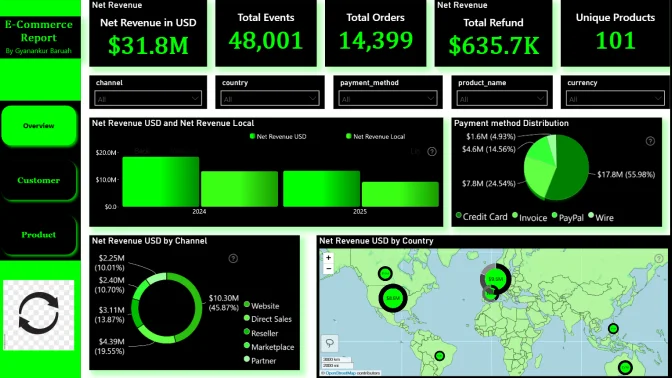
This Power BI report uses the e-commerce sales dataset from a global software retailer that sells subscriptions and add-ons across analytics, design, collaboration, and AI. The report features ZoomCharts Drill Down PRO custom visuals for Power BI. It was submitted to the Onyx Data DataDNA ZoomCharts Mini Challenge in October 2025.
Author description:
A Power BI report analyzing the Onyx Data November E-Commerce dataset. The report highlights revenue performance, customer loyalty behavior, sales channels, product insights, and global market performance. Key metrics include total net revenue, loyal customers, average selling price, and average waiting time before second purchase.
ZoomCharts visuals used
4U Report Challenges
Participate in data challenges, build and submit reports to get free template downloads.
Join CommunityMobile view allows you to interact with the report. To Download the template please switch to desktop view.
Was this helpful? Thank you for your feedback!
Sorry about that.
How can we improve it?