717
Merchandise Sales Analysis 41
Merchandise Sales Analysis 41
Report Author: Christoffer Lanz Berondo
717
Share template with others
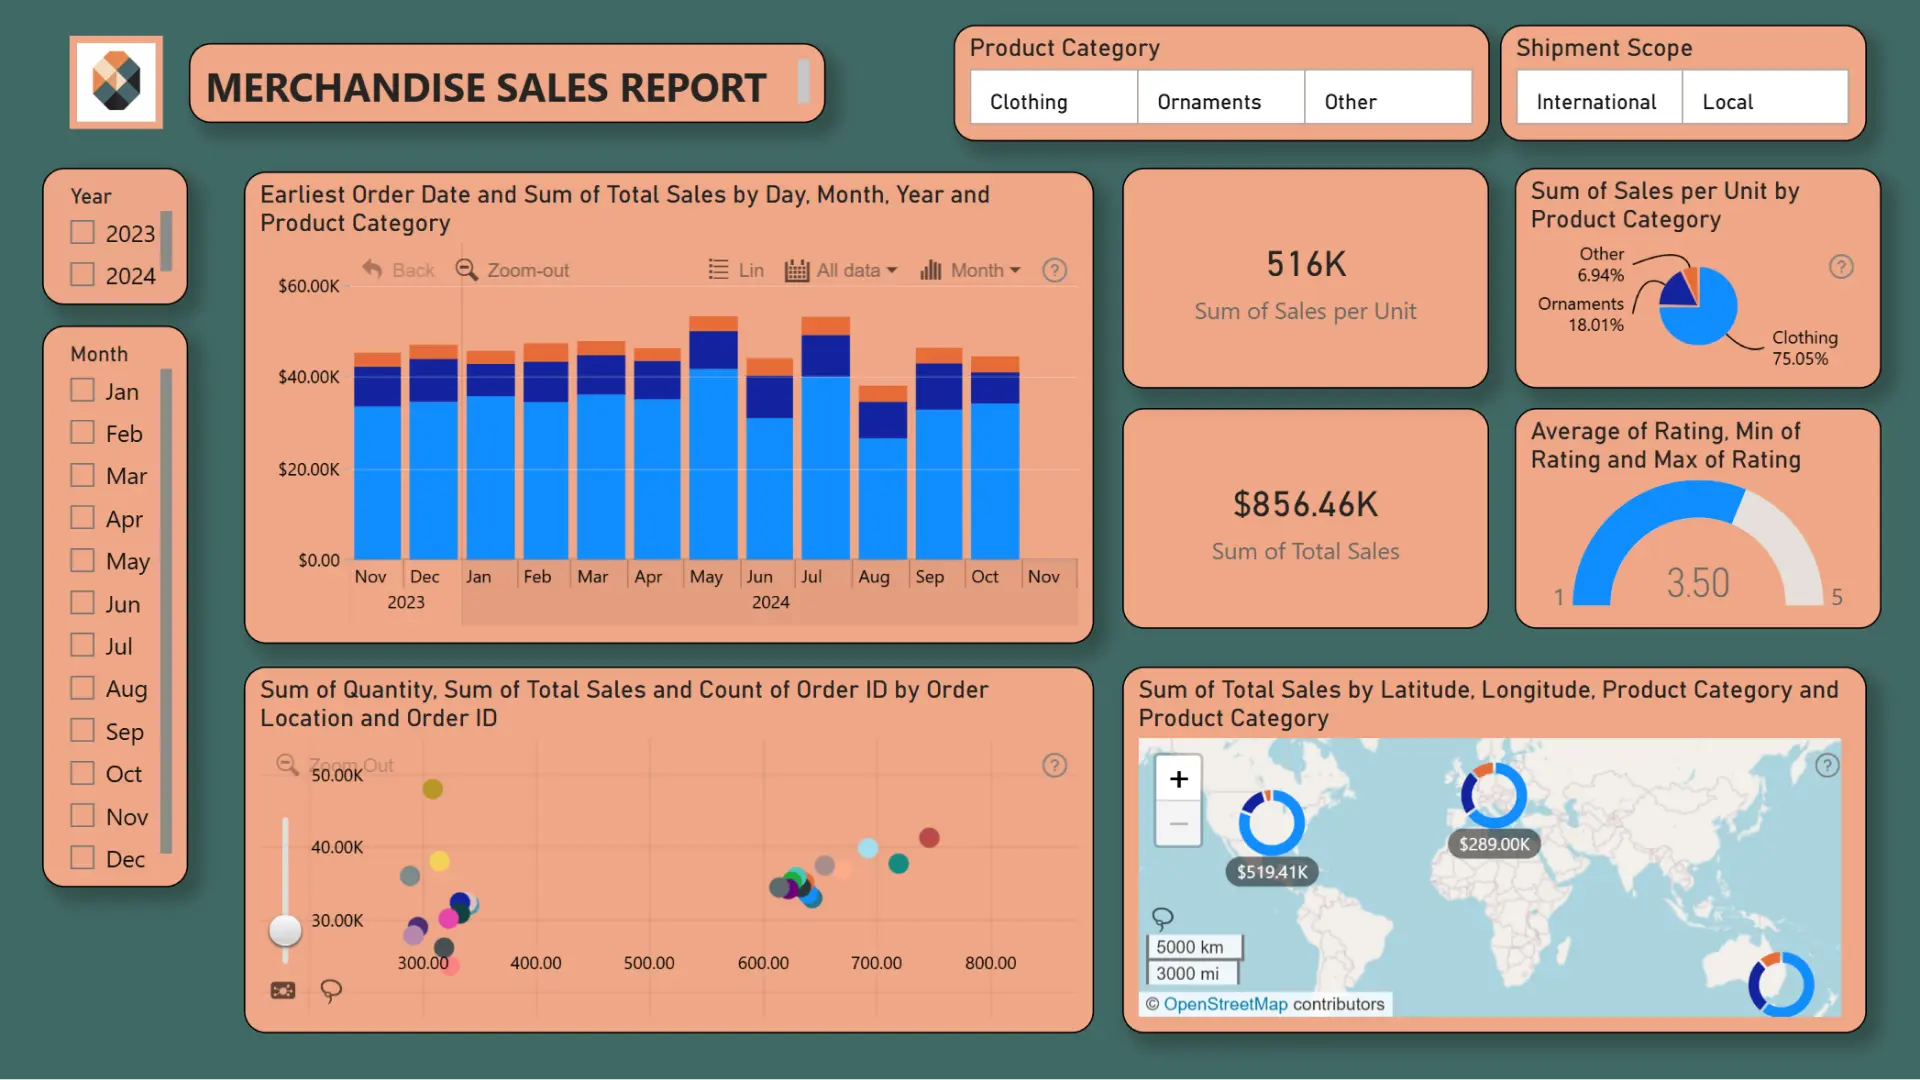
Report submitted for Onyx Data DataDNA ZoomCharts Mini Challenge, January 2025. The report is based on the Merchandise Sales dataset and includes ZoomCharts custom Drill Down PRO visuals for Power BI.
Author's description:
This Power BI report provides a comprehensive overview of merchandise sales performance. It includes:
Sales Quantity Trends – Tracks monthly and yearly sales volume.
Location-Based Sales – Displays sales quantity per location.
Revenue Analysis – Calculates total sales per unit and overall revenue.
Category Performance – Shows the percentage breakdown of sales by category (Ornaments, Clothing, Others).
Customer Satisfaction – Highlights the average customer rating.
Interactive Sales Map – A zoomable map visualizing sales distribution.
This report enables data-driven decision-making by providing clear insights into sales trends and performance.
ZoomCharts visuals used
4U Report Challenges
Participate in data challenges, build and submit reports to get free template downloads.
Join CommunityMobile view allows you to interact with the report. To Download the template please switch to desktop view.
Was this helpful? Thank you for your feedback!
Sorry about that.
How can we improve it?