628
Merchandise Sales Analysis 37
Merchandise Sales Analysis 37
Report Author: Andres Rosales Rubione
628
Share template with others
Report submitted for Onyx Data DataDNA ZoomCharts Mini Challenge, January 2025. The report is based on the Merchandise Sales dataset and includes ZoomCharts custom Drill Down PRO visuals for Power BI.
Author's description:
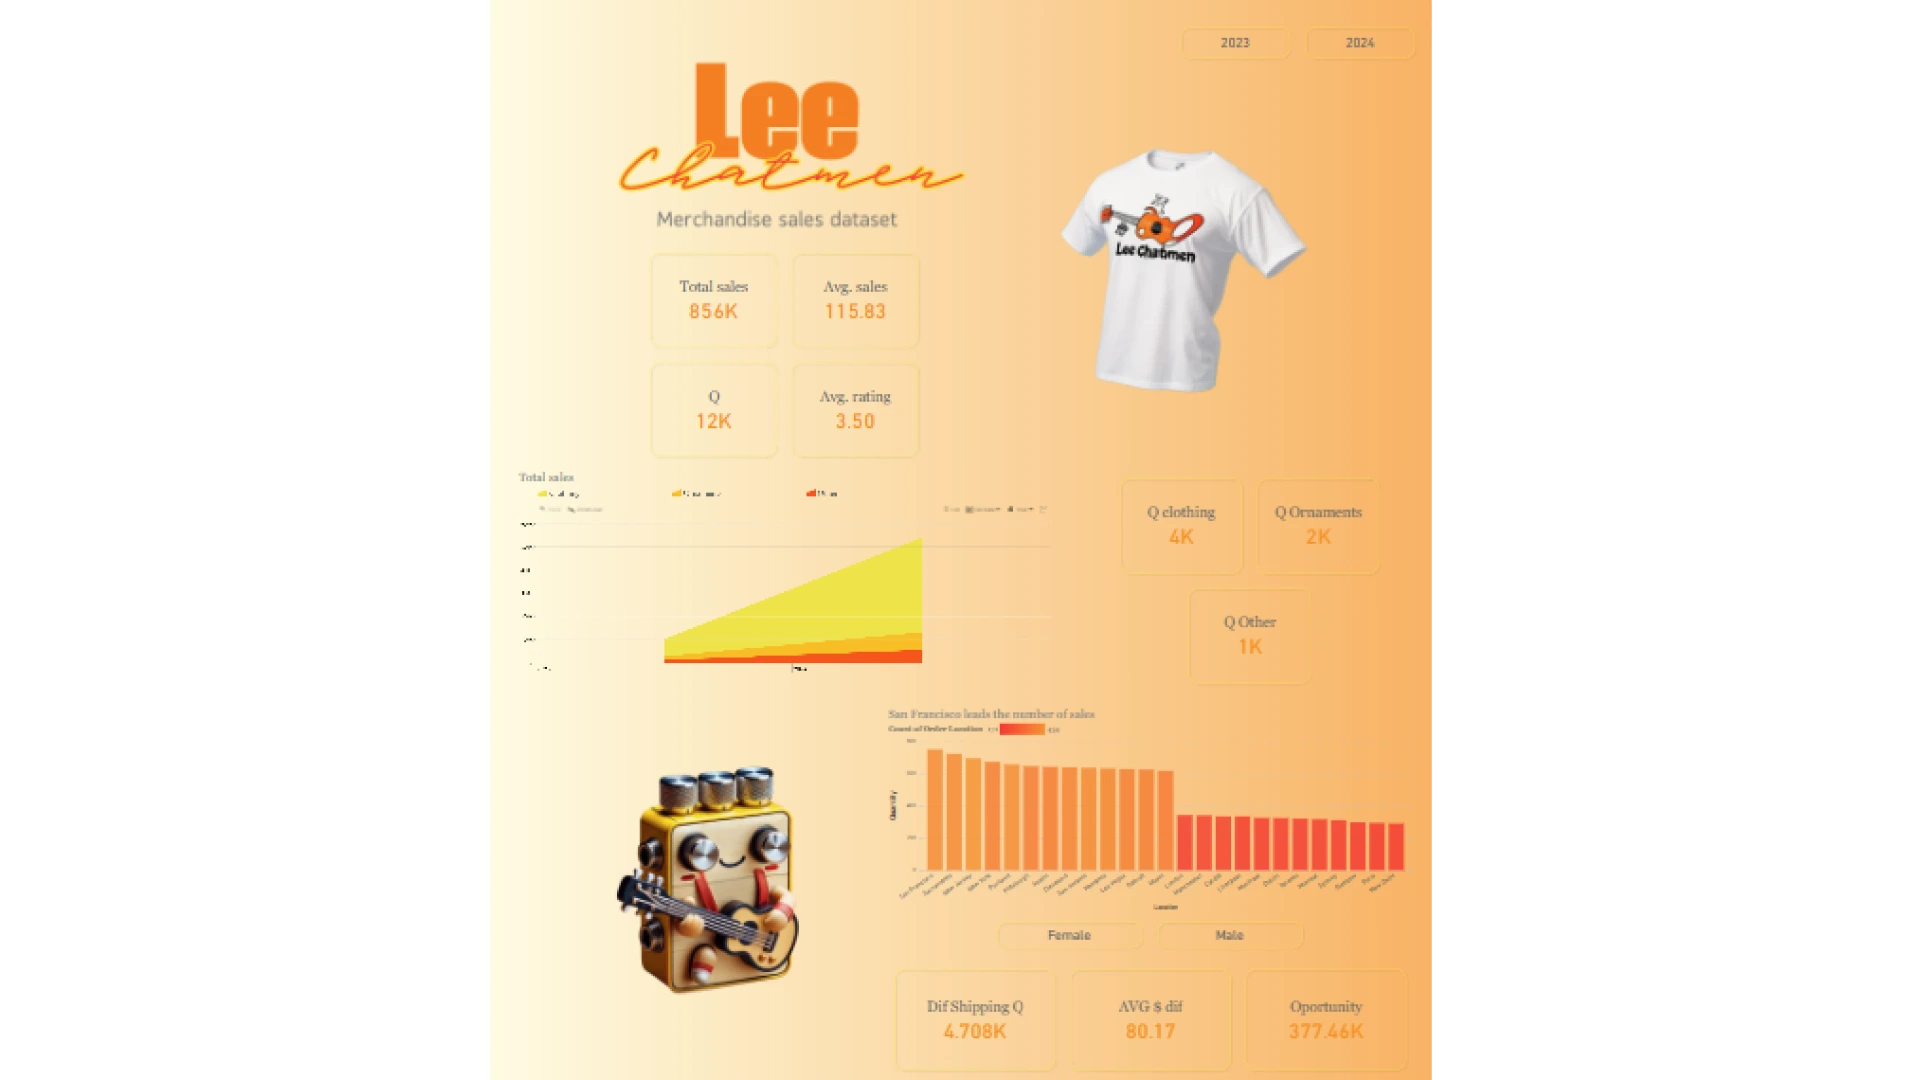
Taking advantage of the fact that in this challenge there were no format limits, I let creativity soar to tell a story through the data that, in addition to containing relevant information, is visually attractive and different. We know that when conducting an analysis, it is crucial to consider the target audience and how we can make an impact by using numbers and visual elements together. On this occasion, the challenge analysis is aimed at a TikTok influencer who became famous for playing popular songs with miniature guitars. Therefore, I saw this as an incredible opportunity to present the findings in a more relaxed and vibrant way.
The report has three main sections:
Commercial Area: This section presents the general values regarding total sales, number of units, and averages.
Localities and Shipping Service: Finding great opportunities in these areas.
Demographic Analysis: Relating customer satisfaction and purchase volume, again highlighting the importance of the shipping service. I hope you enjoy it!
4U Report Challenges
Participate in data challenges, build and submit reports to get free template downloads.
Join CommunityMobile view allows you to interact with the report. To Download the template please switch to desktop view.

Was this helpful? Thank you for your feedback!
Sorry about that.
How can we improve it?