954
Marketing Campaign Analysis 15
Marketing Campaign Analysis 15
Report Author: Miikka Karava
954
Share template with others
Report submitted for OnyxData #DataDNA and ZoomCharts Challenge June 2024. The report was built with the Marketing Campaing Dataset and includes ZoomCharts custom Drill Down PRO visuals for Power BI.
Author's description:
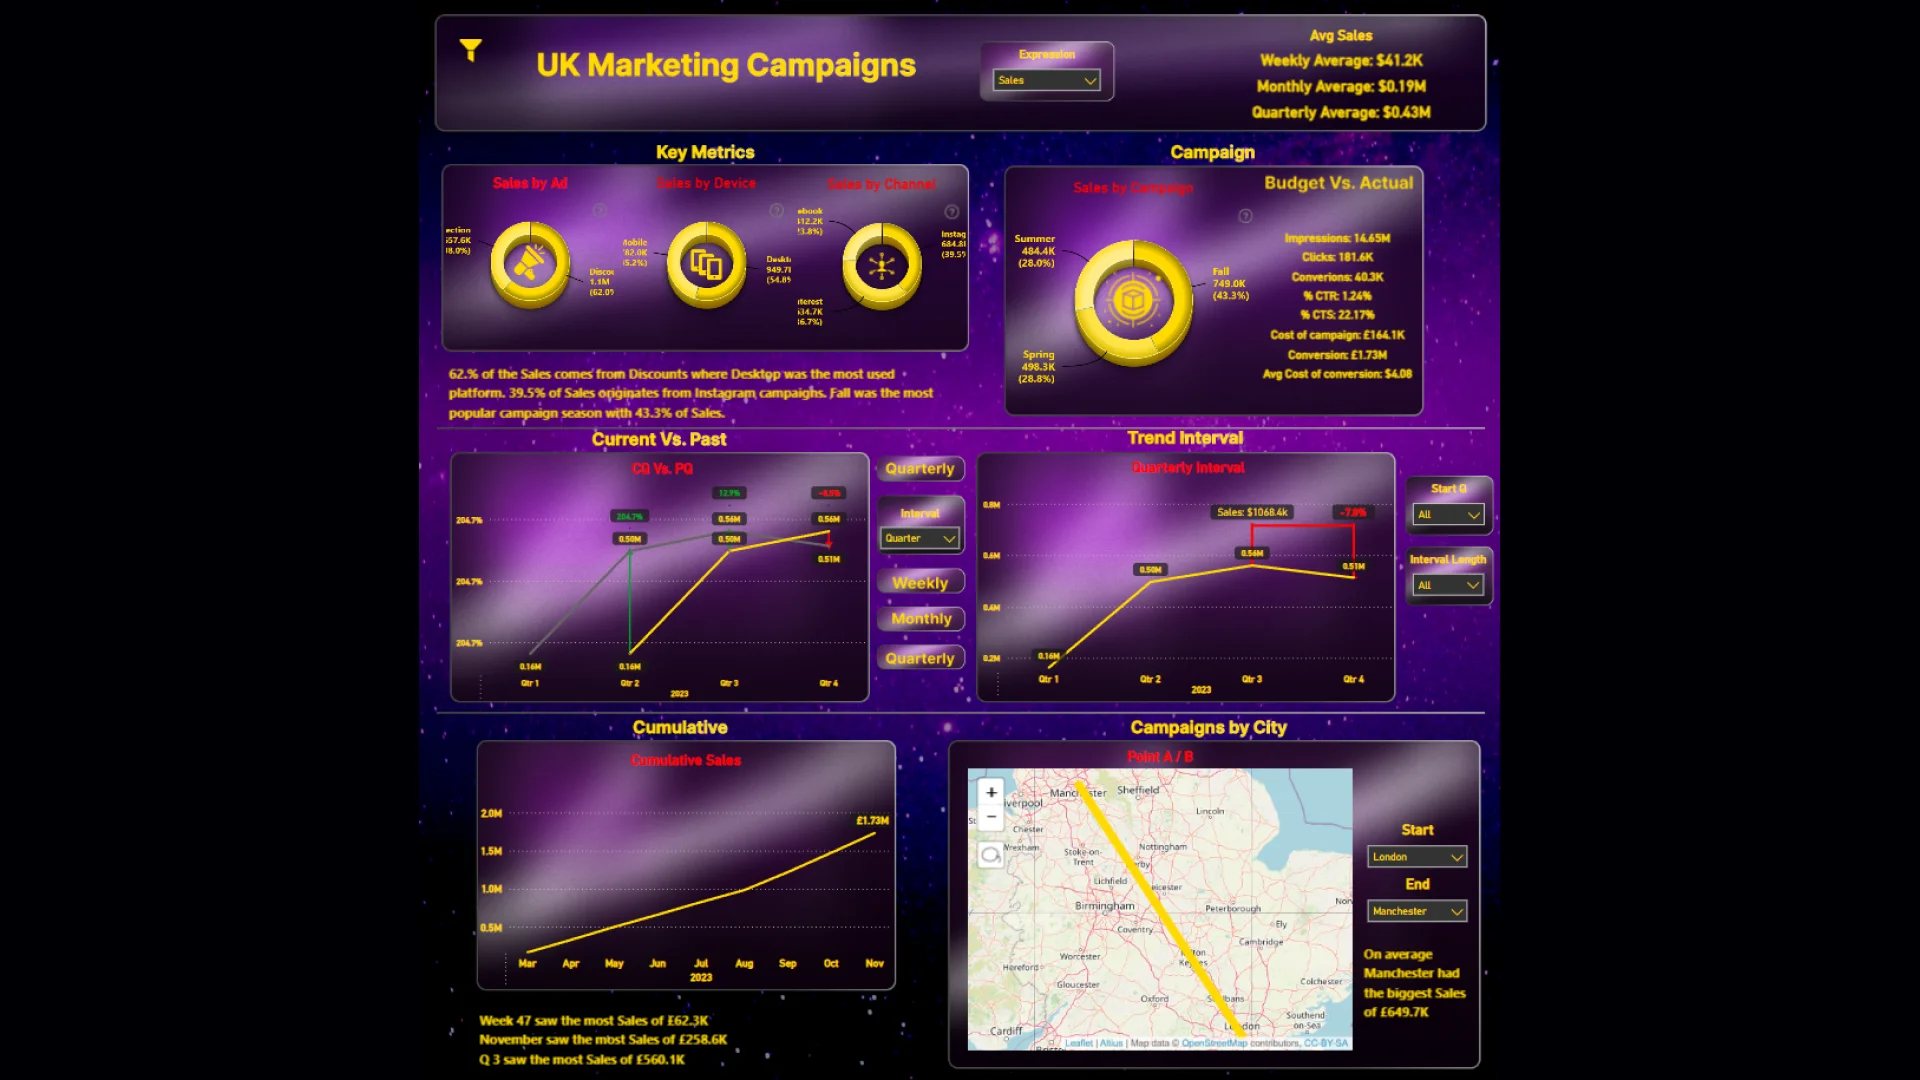
This is my submission to the Onyx Data June 2024 Challenge. The report features a top bar with a dynamic filter panel for detailed analysis. In the middle, an expression filter allows viewing data for different KPIs. On the right, weekly, monthly, and quarterly dates are shown for the selected measure.
Narrative:
- Sales:
- Weekly Average: $3.9K
- Monthly Average: $18.1K
- Quarterly Average: $40.8K
- Budget:
- Weekly Average: $3.9K
- Monthly Average: $18.1K
- Quarterly Average: $40.8K
The report consists of a top filter bar and three sections. The first section covers analytics on campaign ads, devices used, marketing channels, and campaign seasons.
Narrative:
- 🔺 62% of Sales come from Discounts, with Desktop being the most used platform.
- 39.5% of Sales originate from Instagram campaigns.
- Fall was the most popular campaign season, accounting for 43.3% of Sales.
- 🔻 55.8% of the Budget was used in Discounts, with Desktop being the most expensive platform.
- 43.9% of the Budget was spent on Facebook campaigns.
- Fall was the most expensive campaign season, accounting for 48.6% of the budget.
KPIs:
- Impressions: 14.65M
- Clicks: 181.6K
- Conversions: 40.3K
- % CTR: 1.24%
- % CTS: 22.17%
- Cost of campaign: £164.1K
- Conversion: £1.73M
- Avg Cost of conversion: $4.08
The second section reviews marketing trends. The left line chart displays QoQ, MoM, and WoW comparisons of the selected measure with data from past months, quarters, and weeks. The right chart displays trend intervals on monthly, quarterly, and weekly bases, adjustable by start week/month/quarter and duration.
The bottom section includes cumulative totals for the selected measure.
Narrative:
- 📈 Week 47 saw the highest Sales at £62.3K. November had the highest Sales total at £258.6K, with Q3 totaling £560.1K.
- 📉 Week 37 had the highest Budget spending at £6.4K. September had the highest monthly Budget at £27.1K, with Q4 totaling £52.3K.
- 🗺 The last section shows point A to point B comparisons for selected locations, with tooltips displaying differences in each KPI. On average, Manchester had the highest Sales conversion at £649.7K, while London had the highest Budget spending at £66.7K.


4U Report Challenges
Participate in data challenges, build and submit reports to get free template downloads.
Join CommunityMobile view allows you to interact with the report. To Download the template please switch to desktop view.
How to use a PBIX template
Preview the interactive report, download the PBIX file, open it in Power BI Desktop, and replace the same data connection with your own dataset.
Preview and download
Explore the report online and download the PBIX template file.
Open in Power BI Desktop
Open the downloaded PBIX file in Power BI Desktop.
Connect your data
Replace the sample data source with your own dataset.
Refresh and adjust
Refresh the model and update fields or visual were needed.
Save and share
Save your report and publish it for your audience.


