2875
Power BI Merchandise Sales Dashboard Example
Power BI Merchandise Sales Dashboard Example
More Report pages
Report Author: Onkar Bhise
2875
Share template with others
Power BI Merchandise Sales Analysis Dashboard
A Power BI dashboard example for analyzing ecommerce merchandise sales, product performance, customer behavior, and monthly profitability.
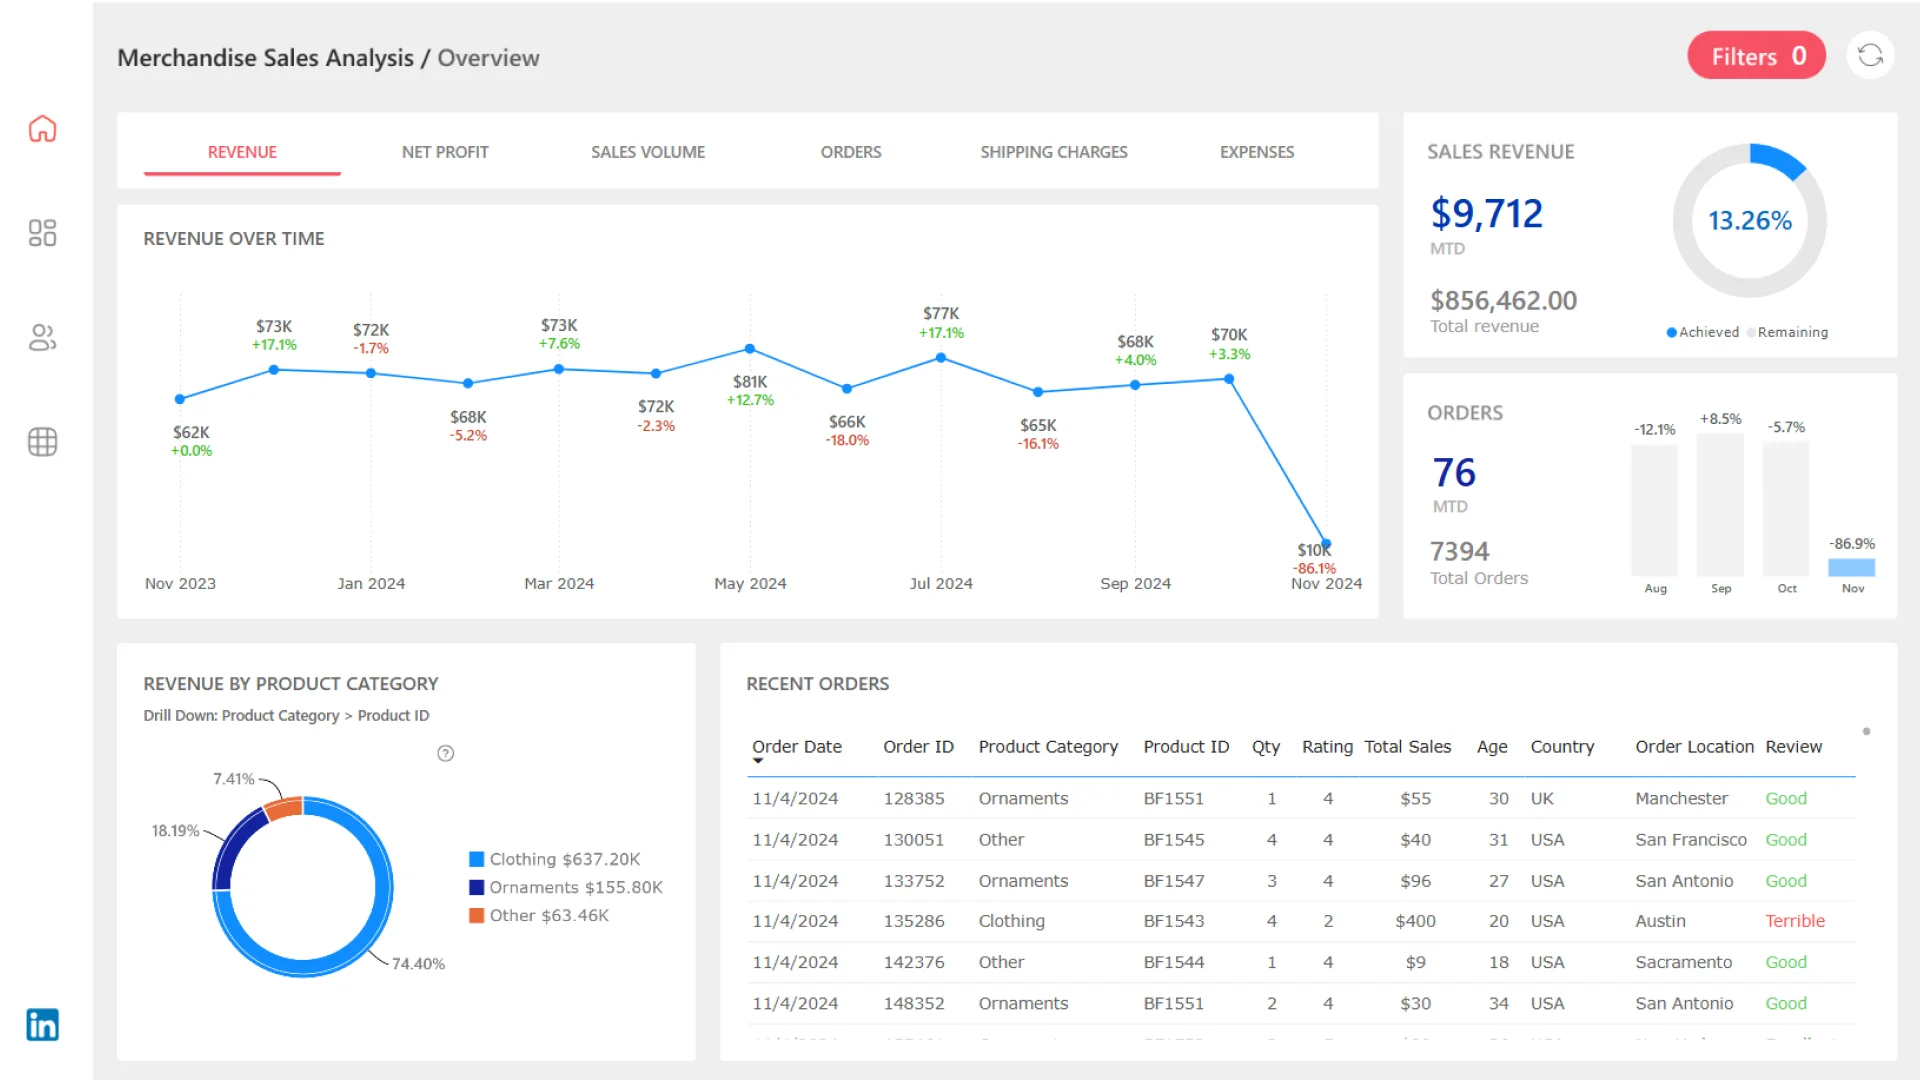
This Power BI merchandise sales analysis dashboard helps users evaluate ecommerce performance across products, customers, countries, revenue, profit, orders, shipping charges, expenses, and customer feedback.
The report is organized into focused analysis pages for product performance, customer behavior, and month-wise financial breakdowns, making it useful for reviewing both commercial results and buyer patterns.
Key Metrics in This Dashboard
Orders
7,394
Units Sold
12,334
Revenue
$856.46K
Net Profit
$370.70K
Dashboard Pages and Insights
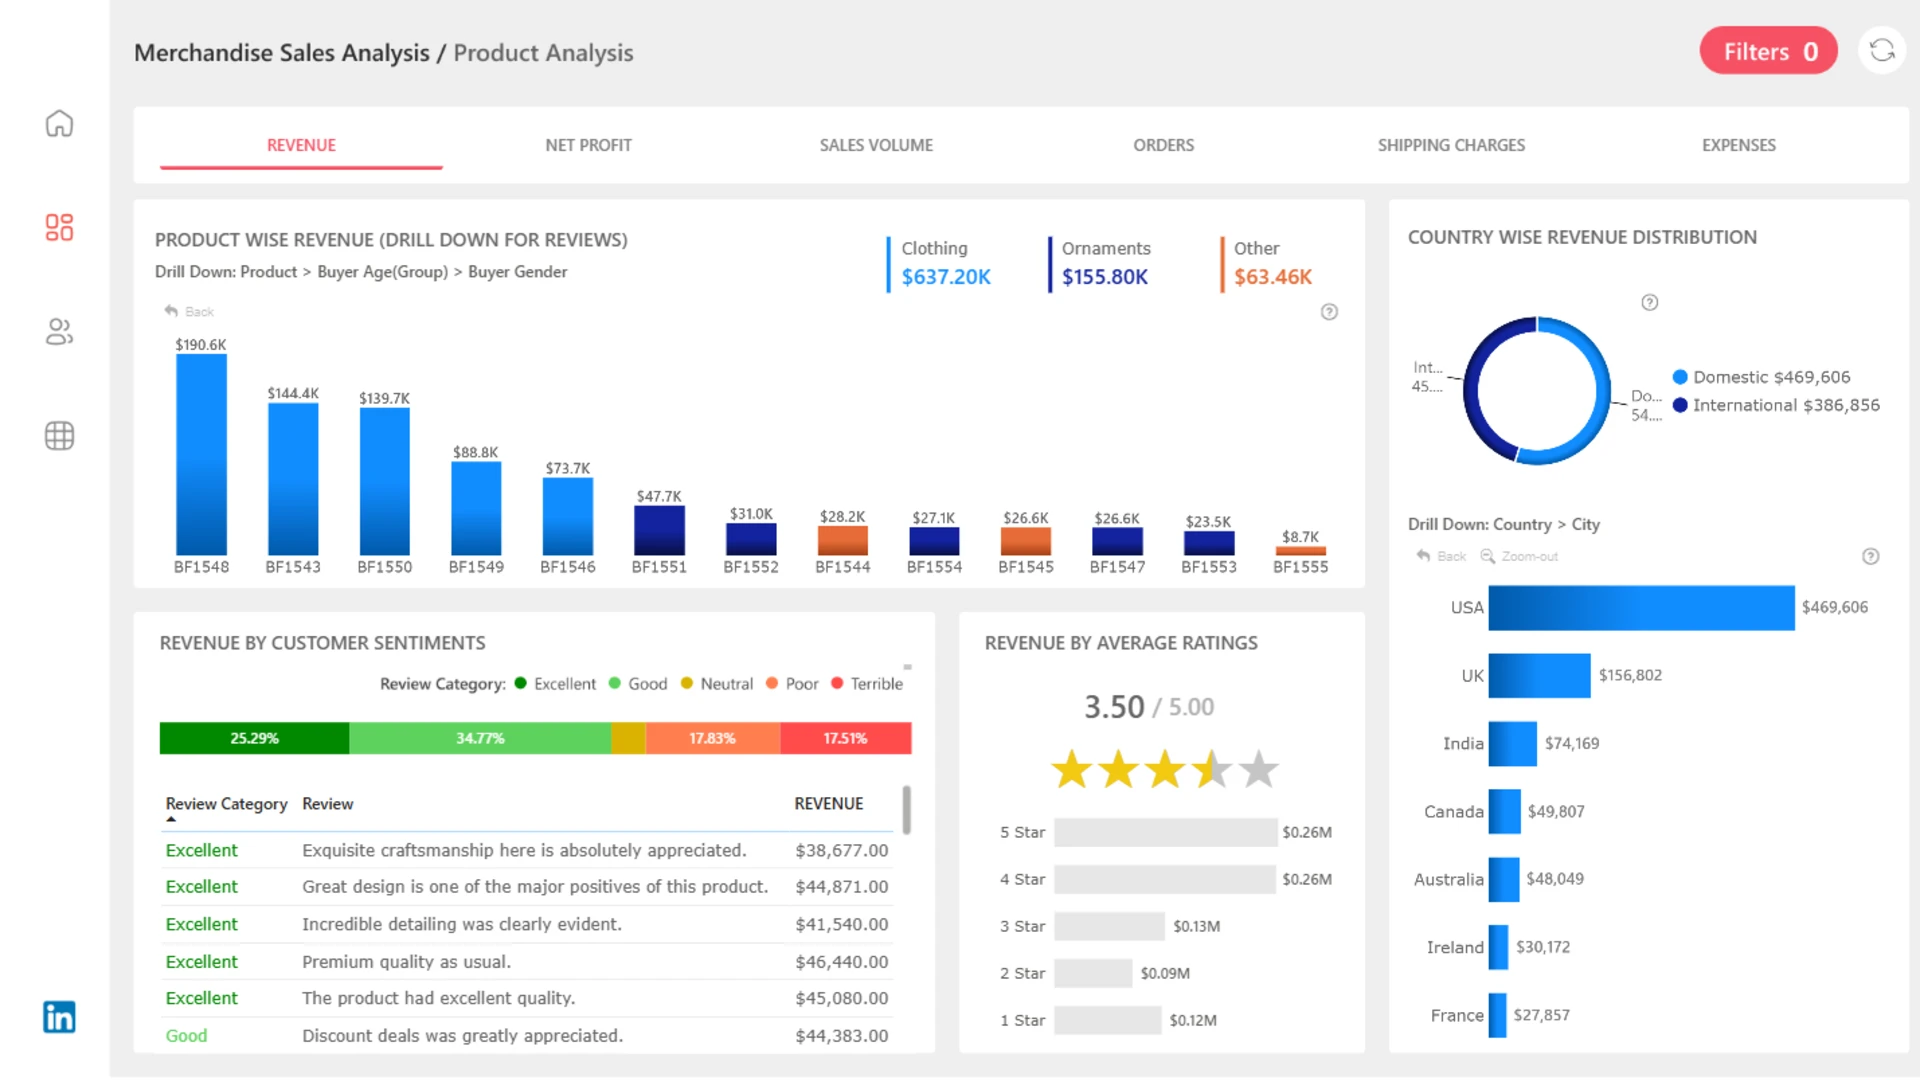
Product Analysis
Review revenue by product ID and product category, including Clothing, Ornaments, and Other merchandise.
Country Performance
Compare domestic and international revenue across the USA, UK, India, Canada, Australia, Ireland, and France.
Customer Sentiment
Connect revenue with average ratings and customer feedback to compare sales performance with buyer satisfaction.
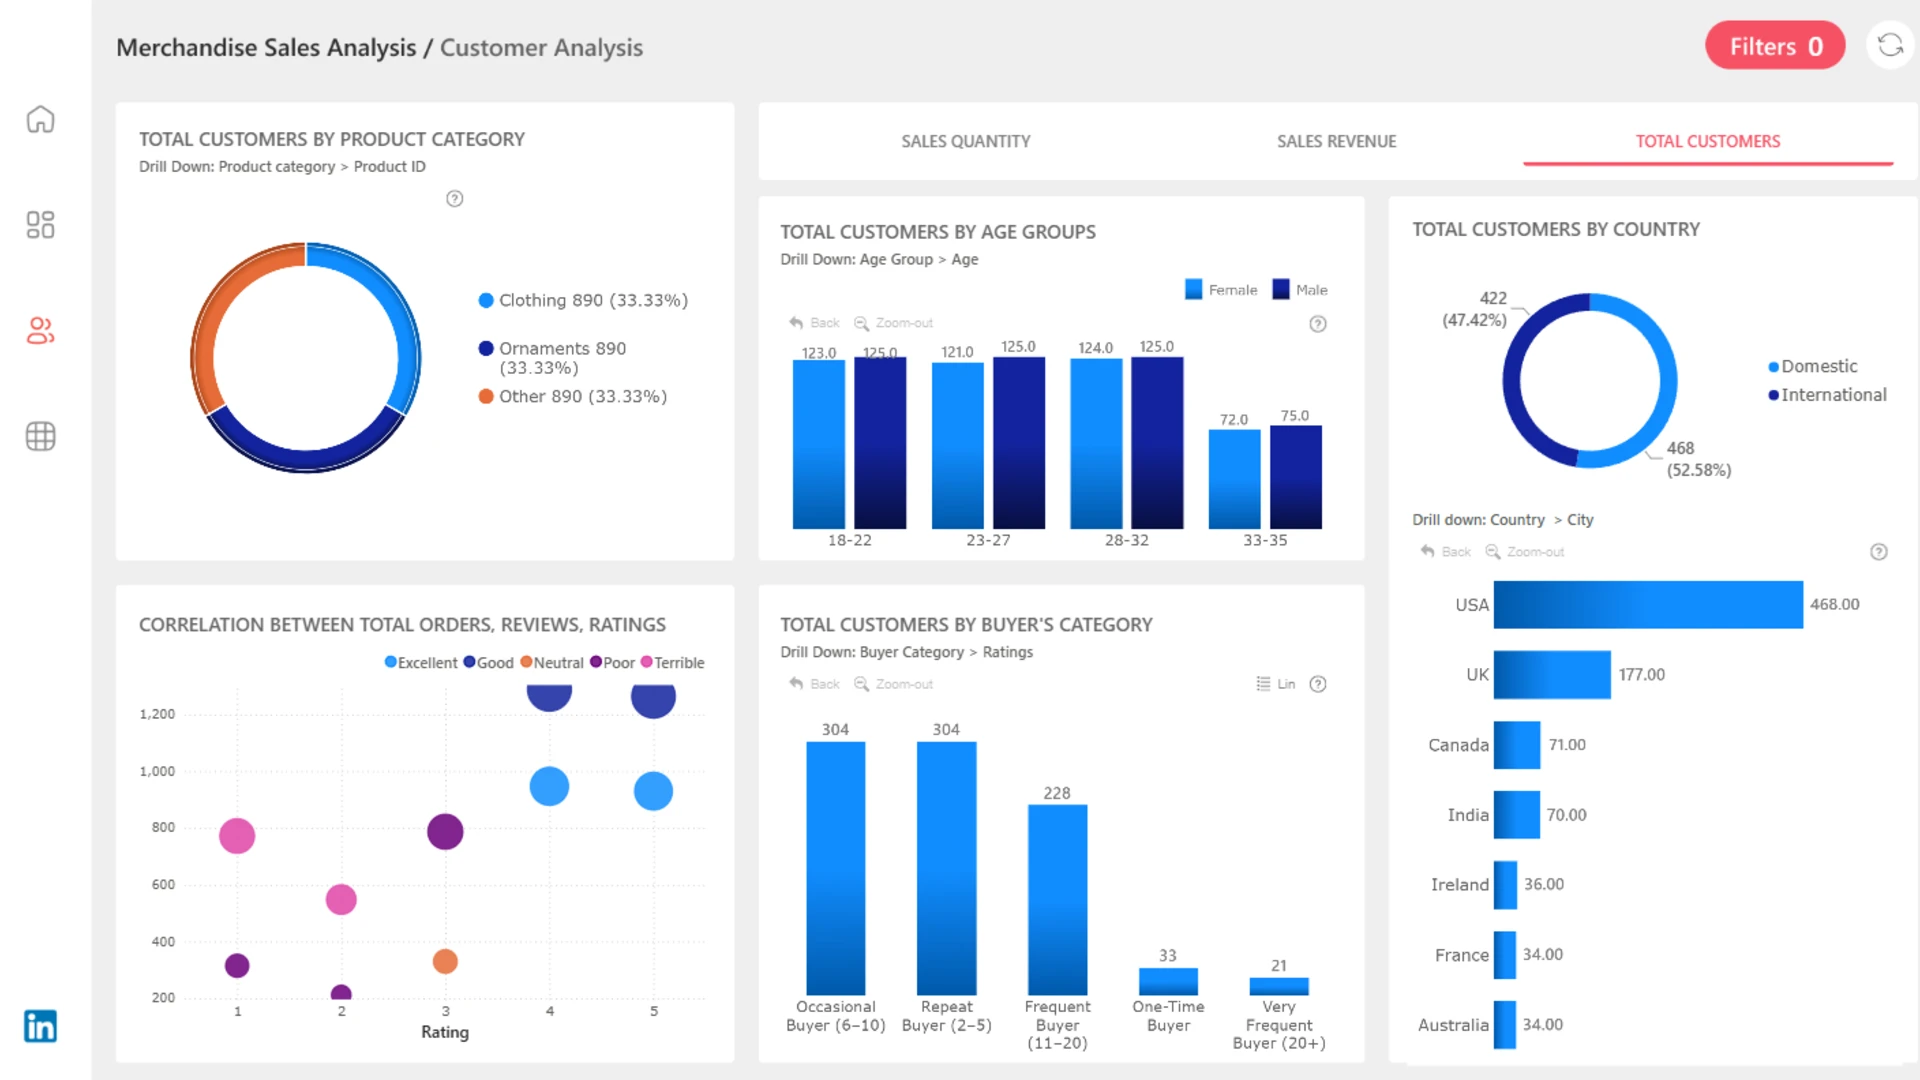
Customer Behavior
Analyze customer distribution by product category, age group, buyer category, country, and gender.
Buyer Frequency
Segment buyers into occasional, repeat, frequent, one-time, and very frequent customer groups.
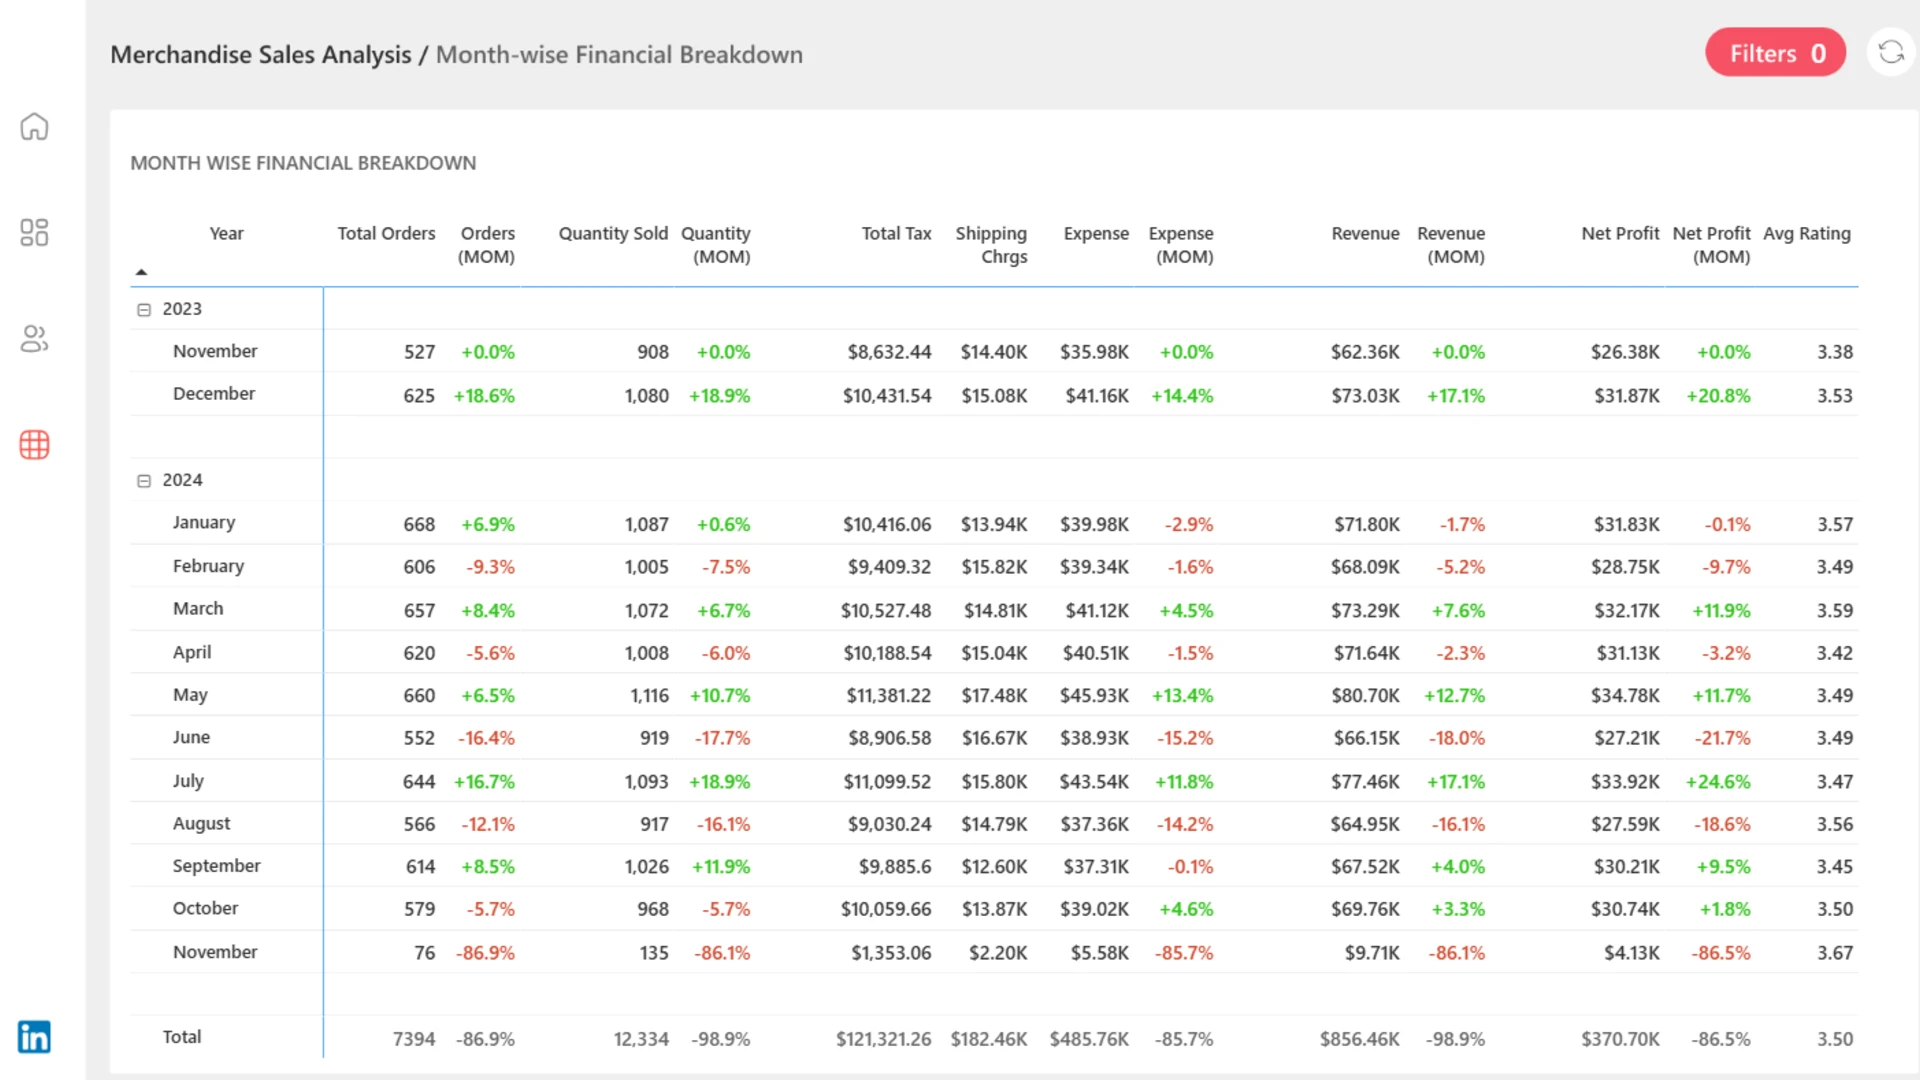
Monthly Financial Breakdown
Track orders, quantity sold, tax, shipping charges, expenses, revenue, net profit, and average rating by month.
Why This Report Is Useful
This dashboard gives sales and ecommerce teams a practical way to monitor merchandise sales performance from multiple angles. It helps users spot growth, declines, profitability changes, product trends, buyer behavior patterns, and customer satisfaction signals.
How to Use This Merchandise Sales Dashboard
Start with product performance
Review categories, product IDs, sales results, and revenue contribution.
Explore customer groups
Compare age bands, buyer categories, gender groups, countries, and purchase frequency.
Analyze monthly results
Use the financial breakdown to spot month-over-month changes in revenue, expenses, and profit.
Dashboard Highlights
With month-over-month comparisons and detailed customer, product, and financial views, this Power BI dashboard helps users understand ecommerce performance and identify opportunities to improve sales, profitability, and customer experience.



4U Report Challenges
Participate in data challenges, build and submit reports to get free template downloads.
Join CommunityMobile view allows you to interact with the report. To Download the template please switch to desktop view.
How to use a PBIX template
Preview the interactive report, download the PBIX file, open it in Power BI Desktop, and replace the same data connection with your own dataset.
Preview and download
Explore the report online and download the PBIX template file.
Open in Power BI Desktop
Open the downloaded PBIX file in Power BI Desktop.
Connect your data
Replace the sample data source with your own dataset.
Refresh and adjust
Refresh the model and update fields or visual were needed.
Save and share
Save your report and publish it for your audience.


