555
Interactive Energy Management Dashboard
Interactive Energy Management Dashboard
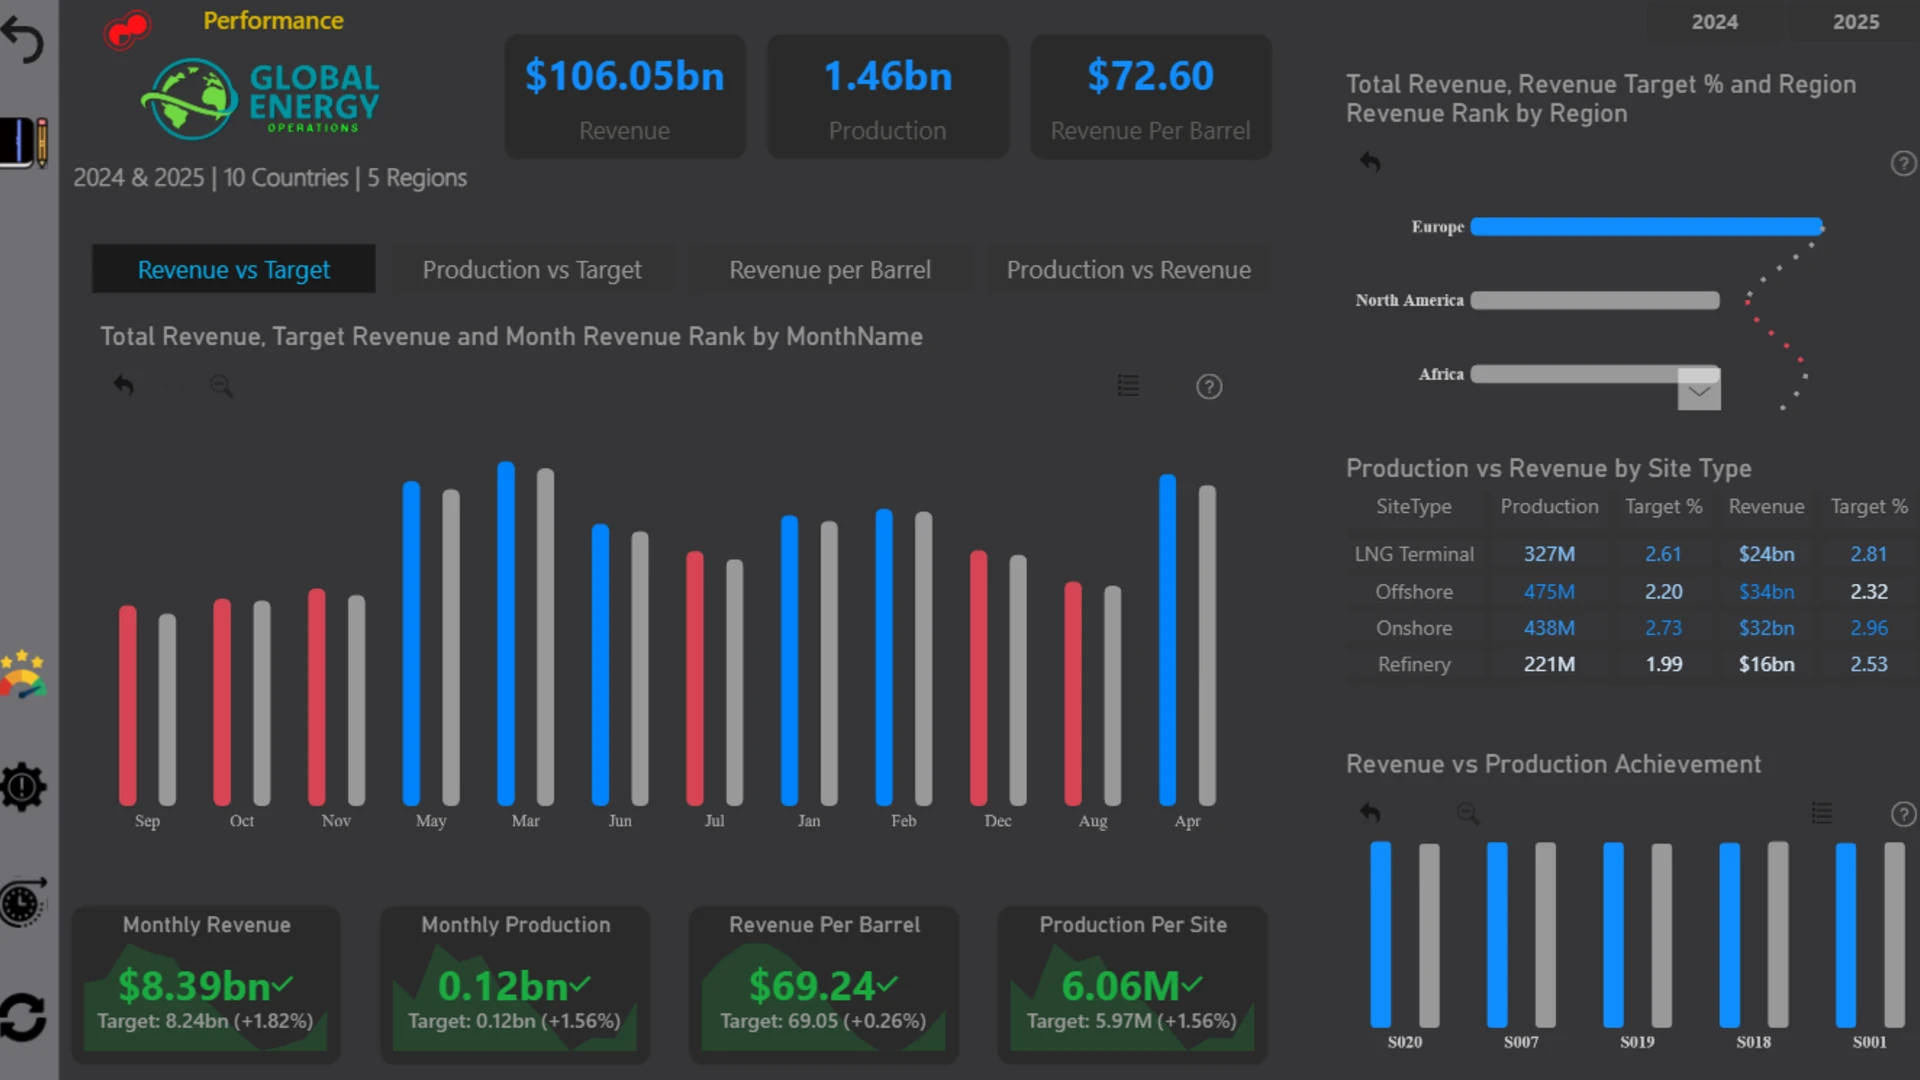
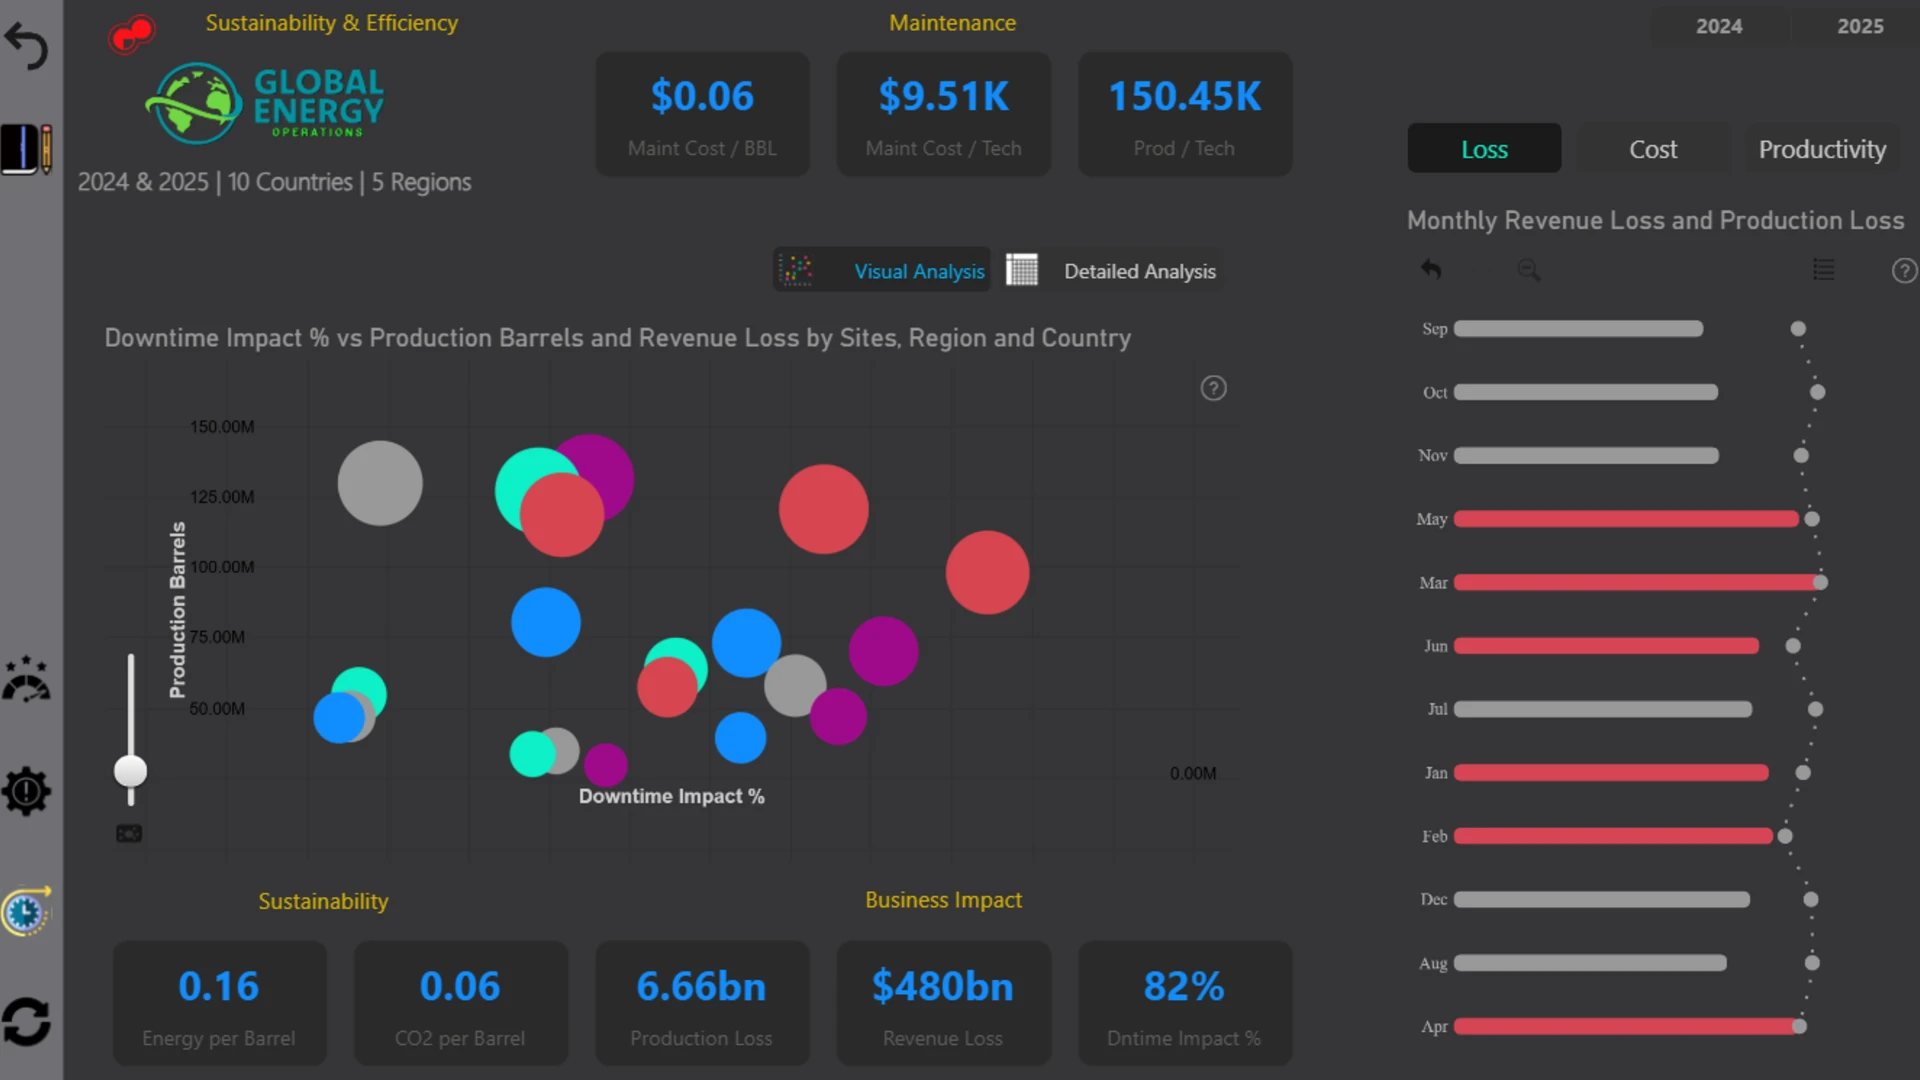
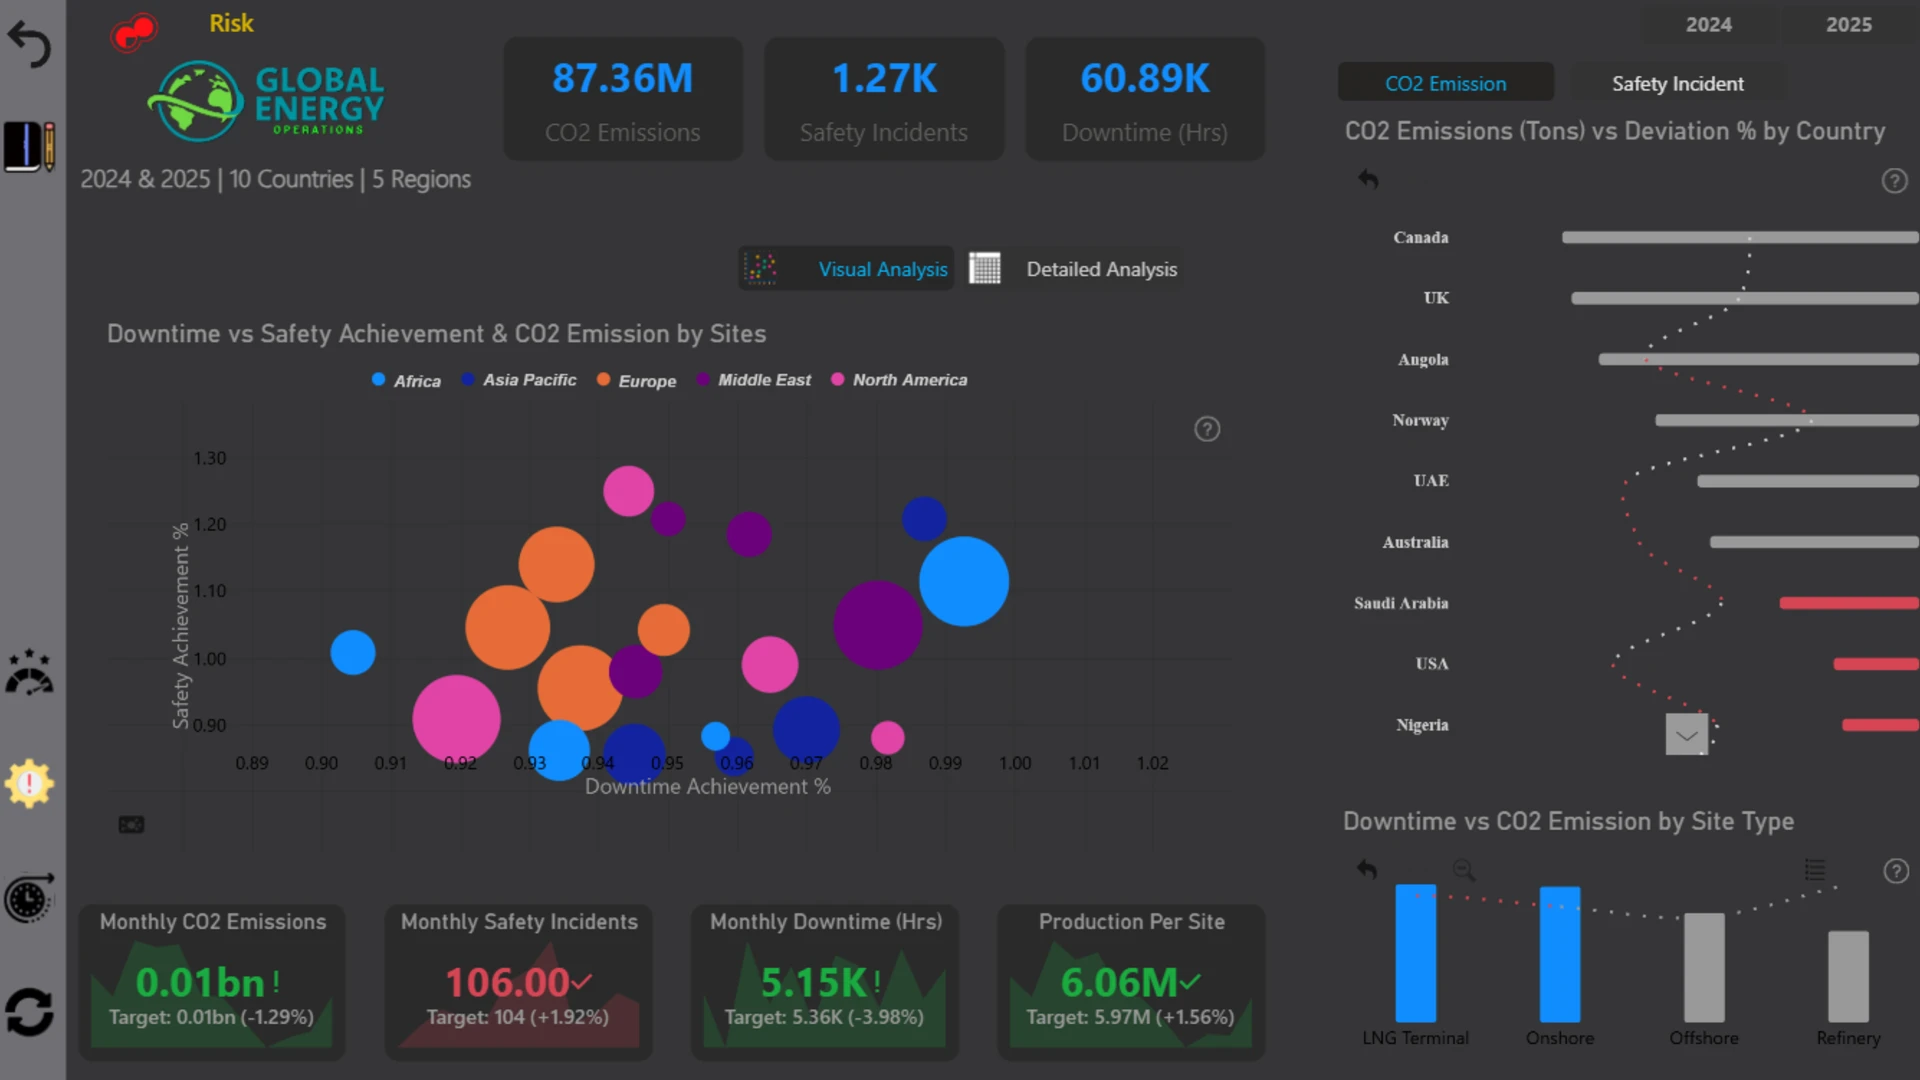
More Report pages
Report Author: Samim Imtiaz
555
Share template with others
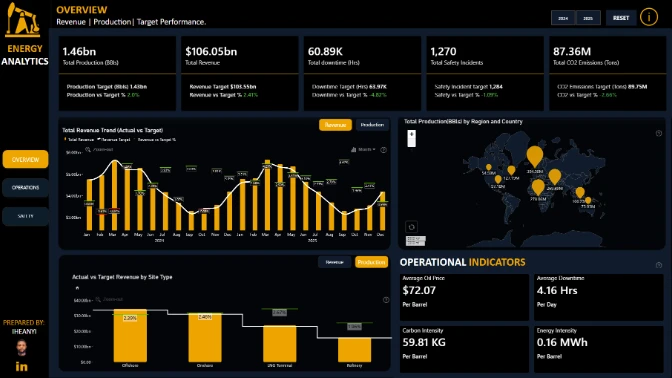
Explore an interactive Oil, Gas & Energy Operations Analytics dashboard built in Power BI to monitor production performance, operational risk, maintenance efficiency, sustainability metrics, and financial outcomes. The report helps stakeholders identify underperforming sites, track target achievement, and optimize operational performance through interactive drill-down exploration.
This report was created for the ZoomCharts 4U Report Challenge June 2026, where Power BI developers showcase their data visualization expertise by solving real-world business use cases.



4U Report Challenges
Participate in data challenges, build and submit reports to get free template downloads.
Join CommunityMobile view allows you to interact with the report. To Download the template please switch to desktop view.
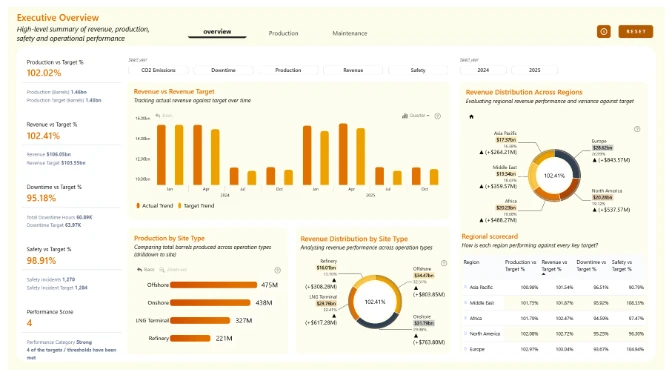
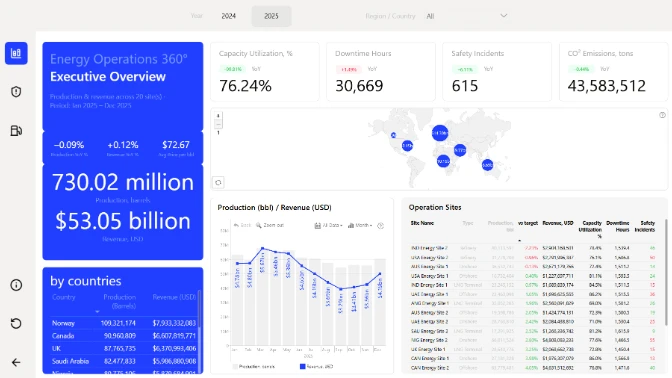
How to use a PBIX template
Preview the interactive report, download the PBIX file, open it in Power BI Desktop, and replace the same data connection with your own dataset.
Preview and download
Explore the report online and download the PBIX template file.
Open in Power BI Desktop
Open the downloaded PBIX file in Power BI Desktop.
Connect your data
Replace the sample data source with your own dataset.
Refresh and adjust
Refresh the model and update fields or visual were needed.
Save and share
Save your report and publish it for your audience.


