1187
HR Analytics Report
HR Analytics Report
More Report pages
Report Author: Jason Carl Martin Tupas
1187
Share template with others
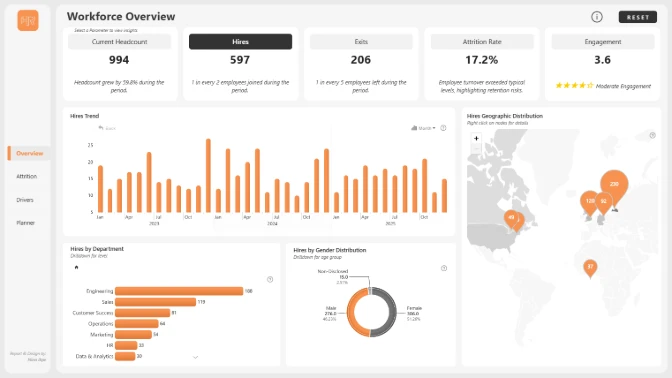
Report submitted for FP20 Analytics ZoomCharts Challenge 15 (April 2024). The report was built with the HR Analysis dataset and includes ZoomCharts custom Drill Down PRO visuals for Power BI.
Author's description:
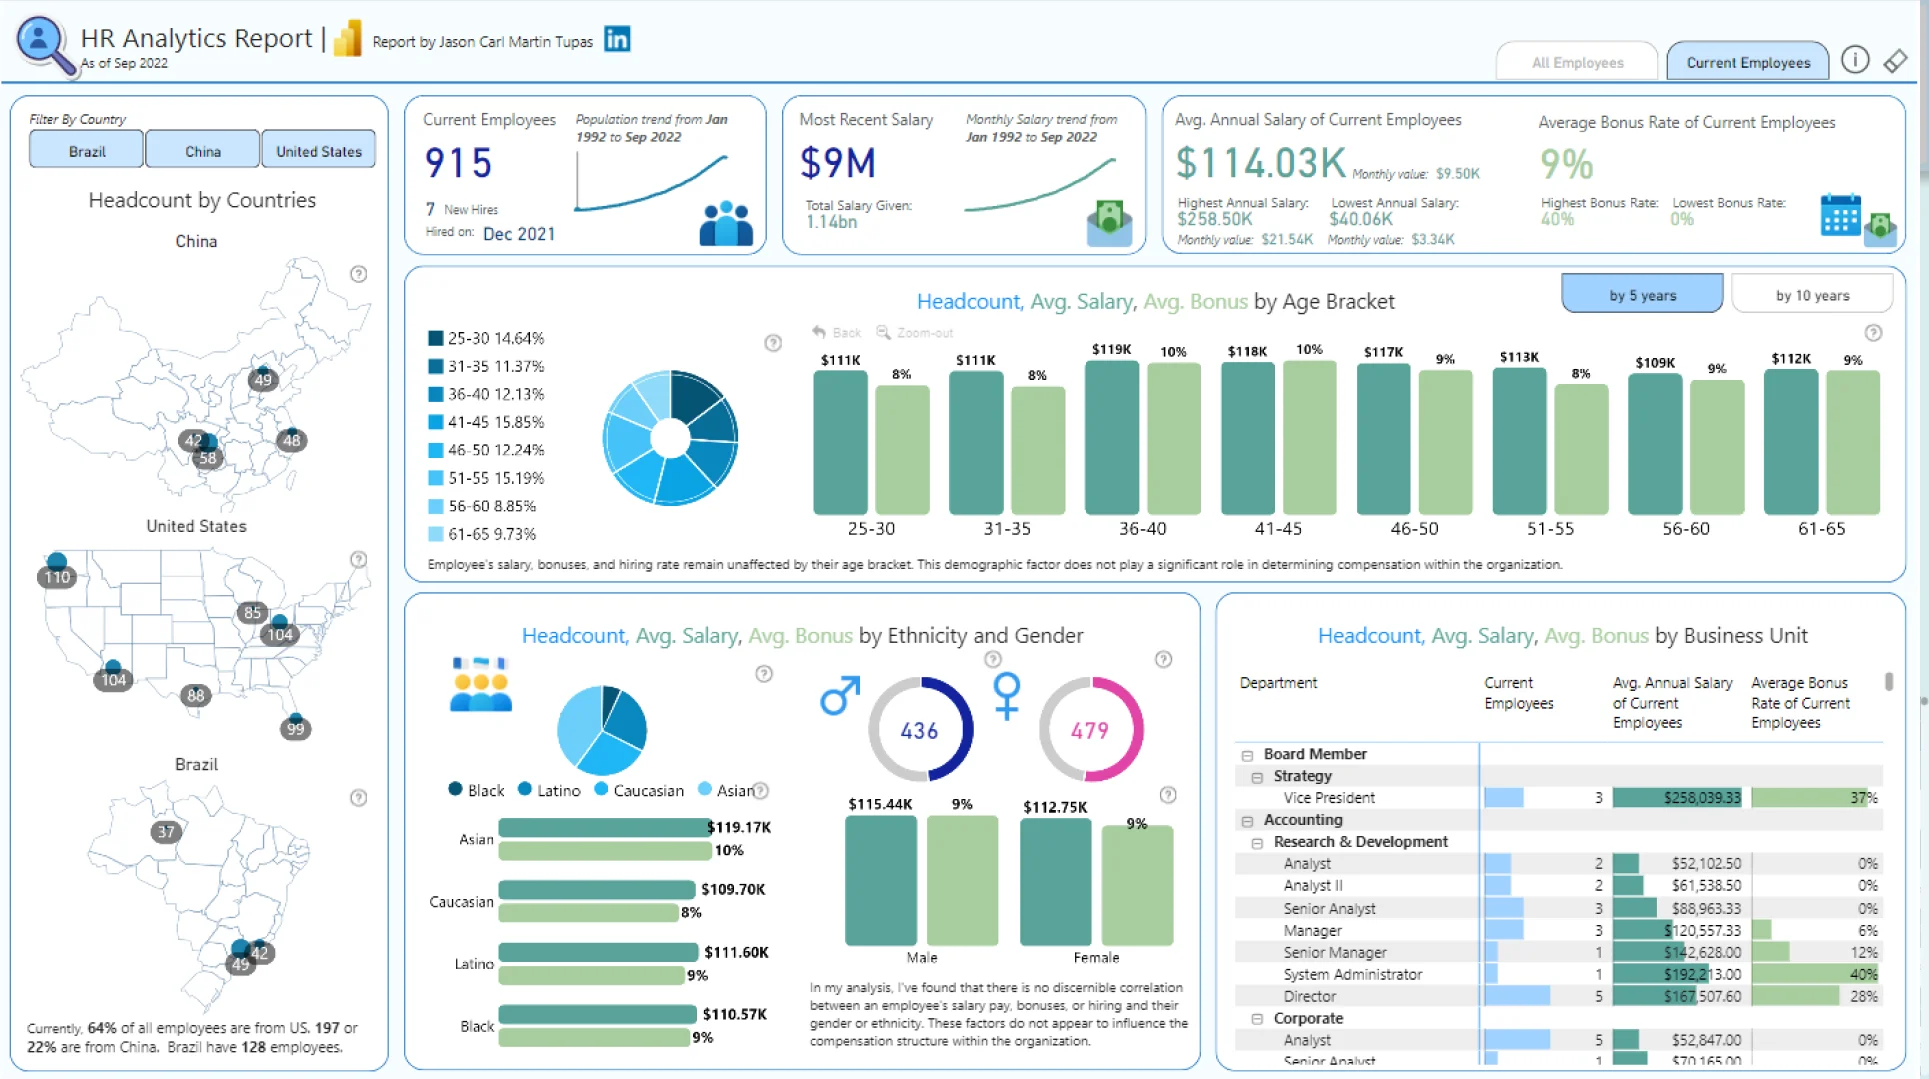
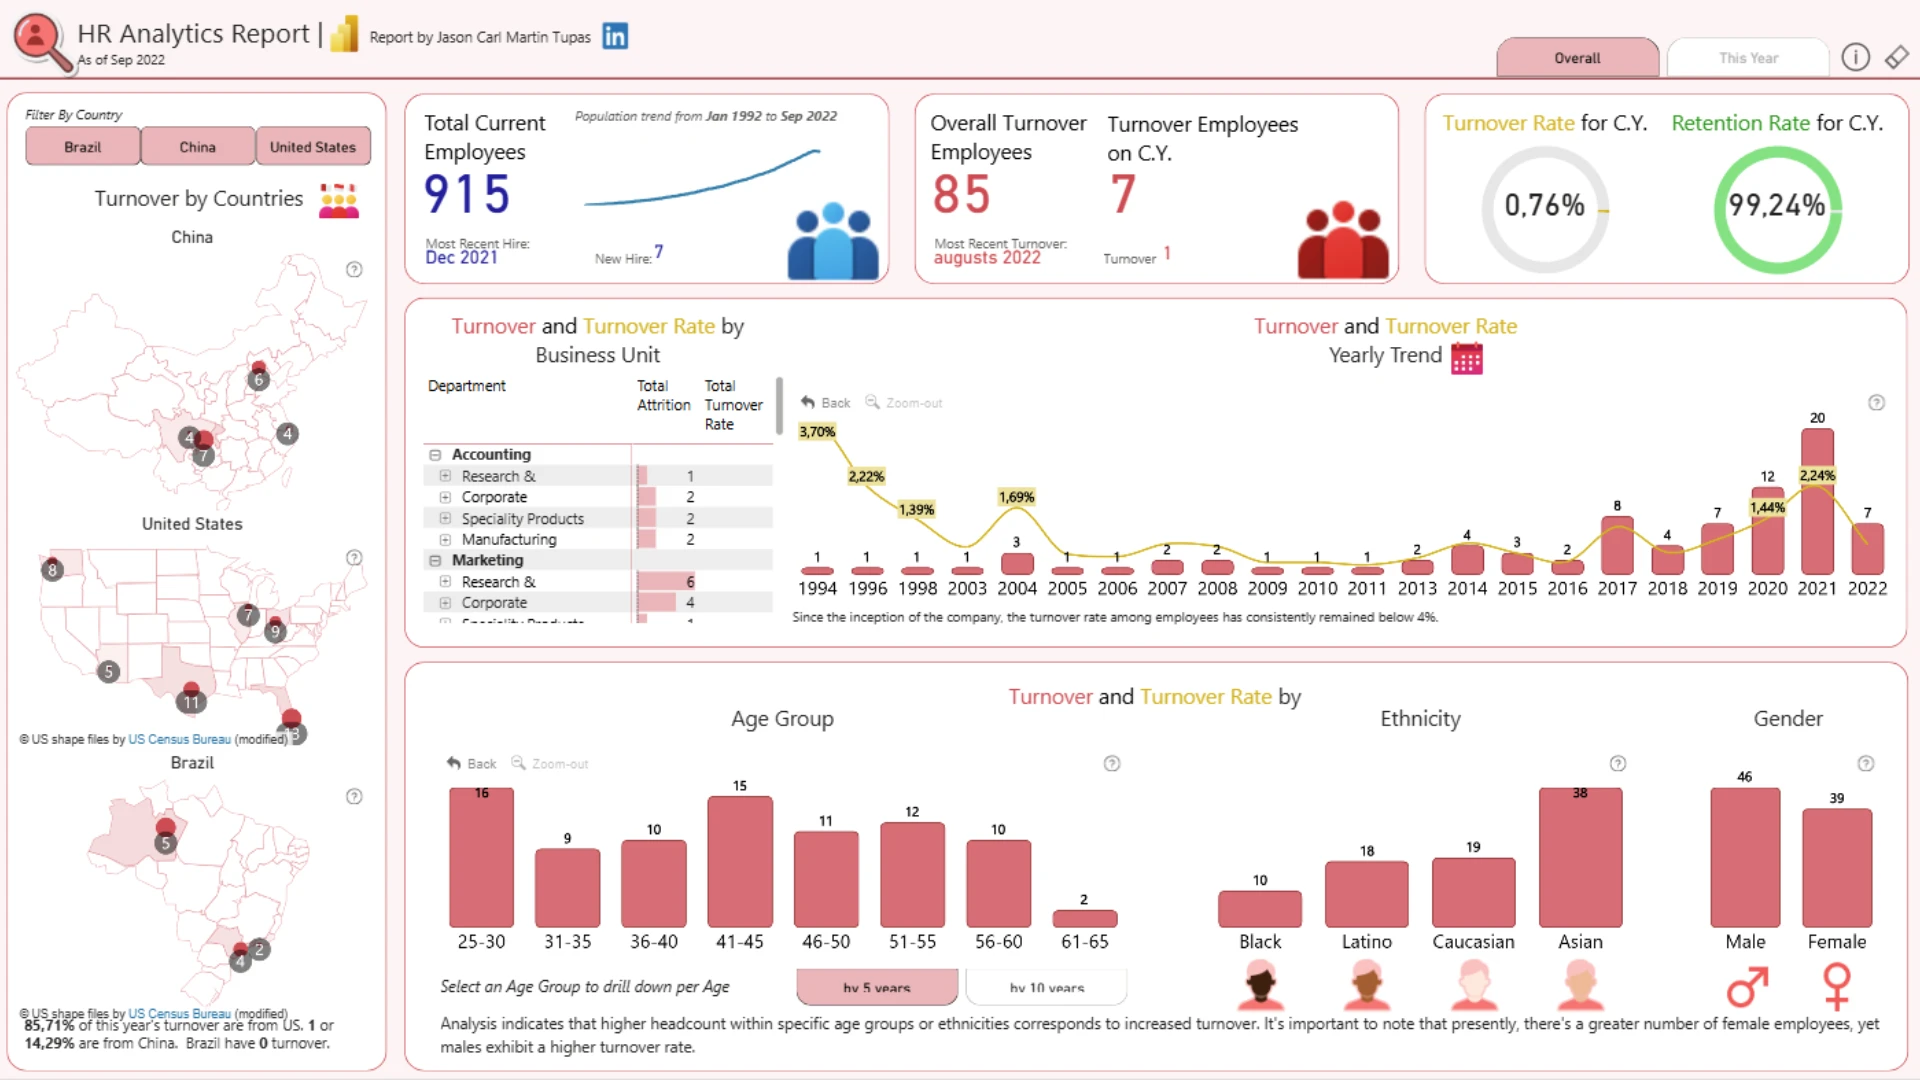
This Power BI report offers a comprehensive analysis of employee metrics across two pages, focusing on compensation and diversity on the first and turnover and retention on the second. Extracted from an Excel source, the first page delves into headcount, salaries, and bonuses by demographic backgrounds and business units, while the second examines turnover rates and retention strategies, also segmented by demographics and business units.
Designed for HR executives and department managers, this report aids in refining recruitment strategies, optimizing compensation, and enhancing retention, ultimately supporting a more equitable and stable workplace.
ZoomCharts visuals used




4U Report Challenges
Participate in data challenges, build and submit reports to get free template downloads.
Join CommunityMobile view allows you to interact with the report. To Download the template please switch to desktop view.
How to use a PBIX template
Preview the interactive report, download the PBIX file, open it in Power BI Desktop, and replace the same data connection with your own dataset.
Preview and download
Explore the report online and download the PBIX template file.
Open in Power BI Desktop
Open the downloaded PBIX file in Power BI Desktop.
Connect your data
Replace the sample data source with your own dataset.
Refresh and adjust
Refresh the model and update fields or visual were needed.
Save and share
Save your report and publish it for your audience.


