22488
Power BI HR Analytics Dashboard Template
Power BI HR Analytics Dashboard Template
More Report pages
Report Author: Overhauled by ZoomCharts
22488
Share template with others
Summary
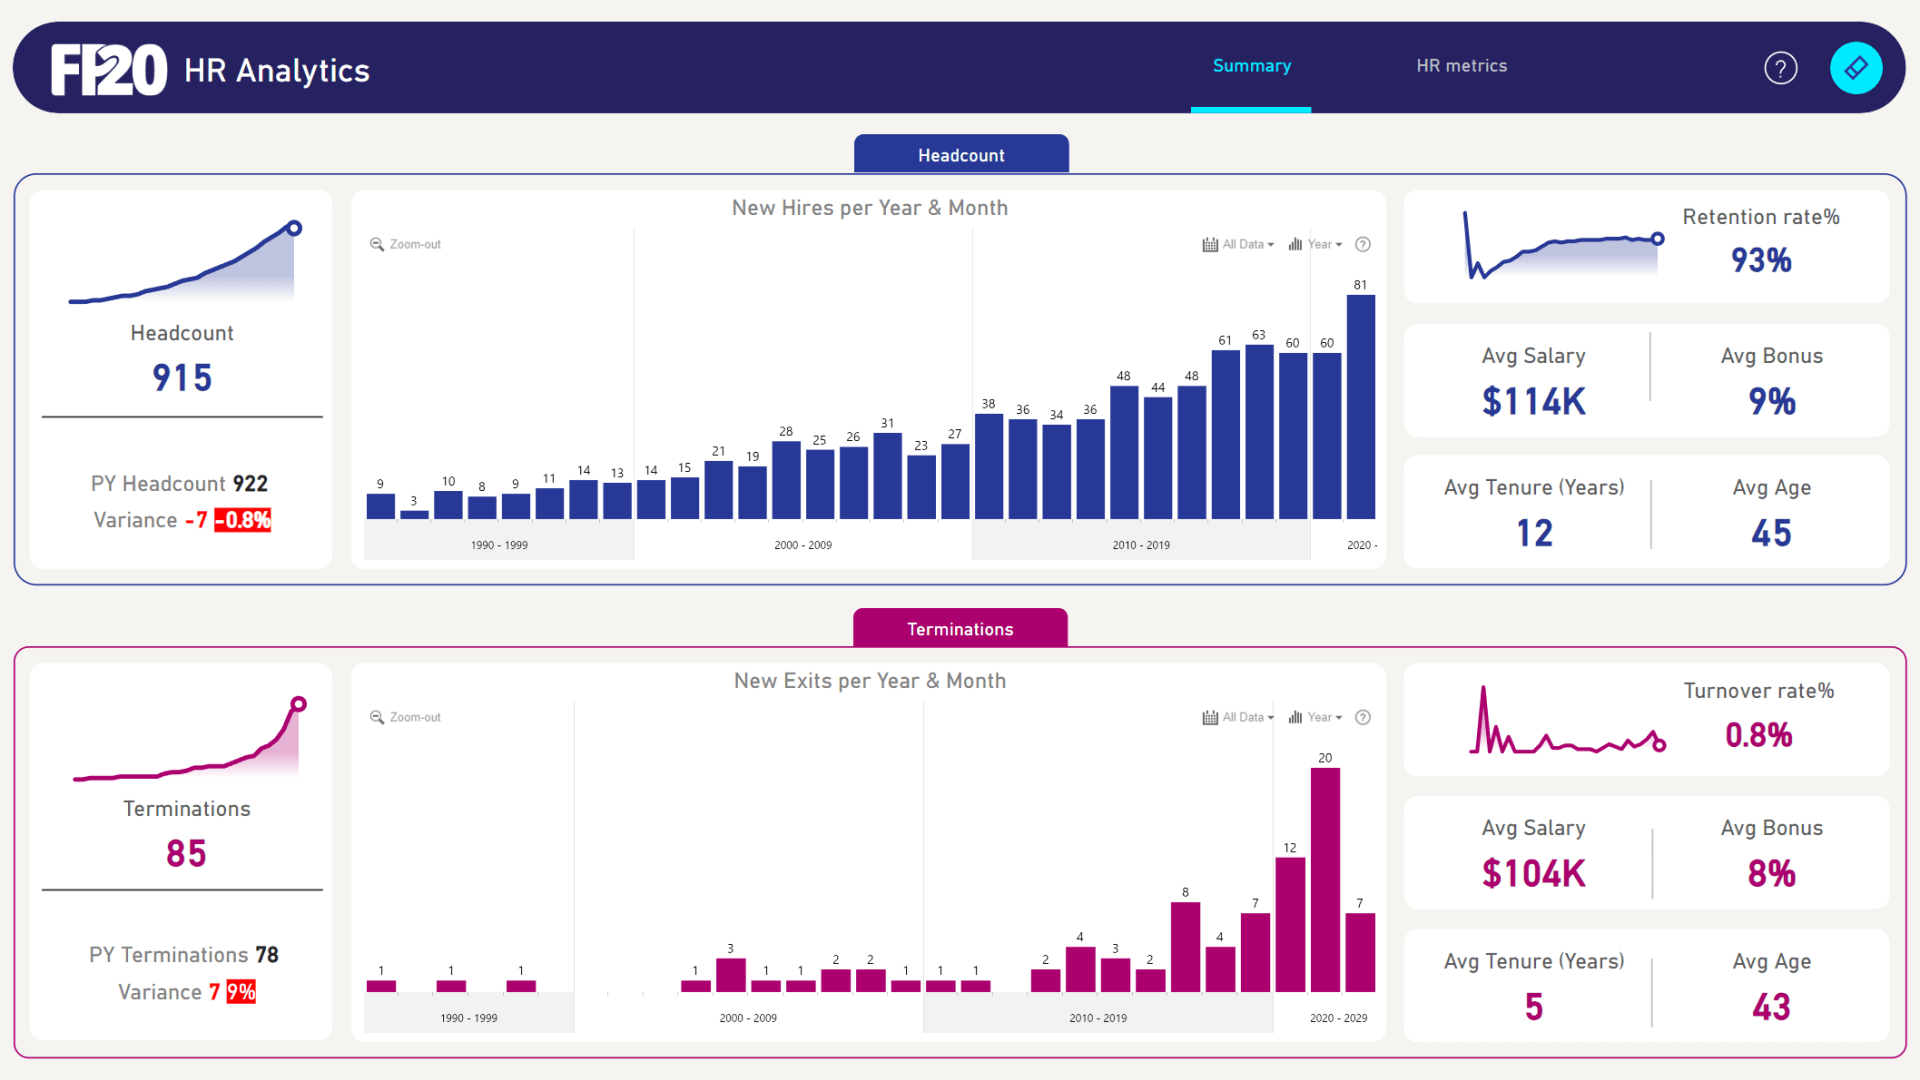
This Power BI HR Analytics Dashboard Template by Mina Saad is the winning entry from the FP20 Analytics April 2024 ZoomCharts Challenge. It helps organizations monitor workforce trends by presenting headcount, hiring, terminations, and other HR metrics in a clear, interactive report.
Key Insights of the Power BI HR Analytics Dashboard
The report is structured across two pages. The first provides an overview of workforce activity, while the second analyzes HR metrics across employee demographics. Its key insights include:
- Headcount: monitor workforce size and changes over time
- Hiring: analyze employee hiring trends
- Terminations: review employee departures and termination patterns
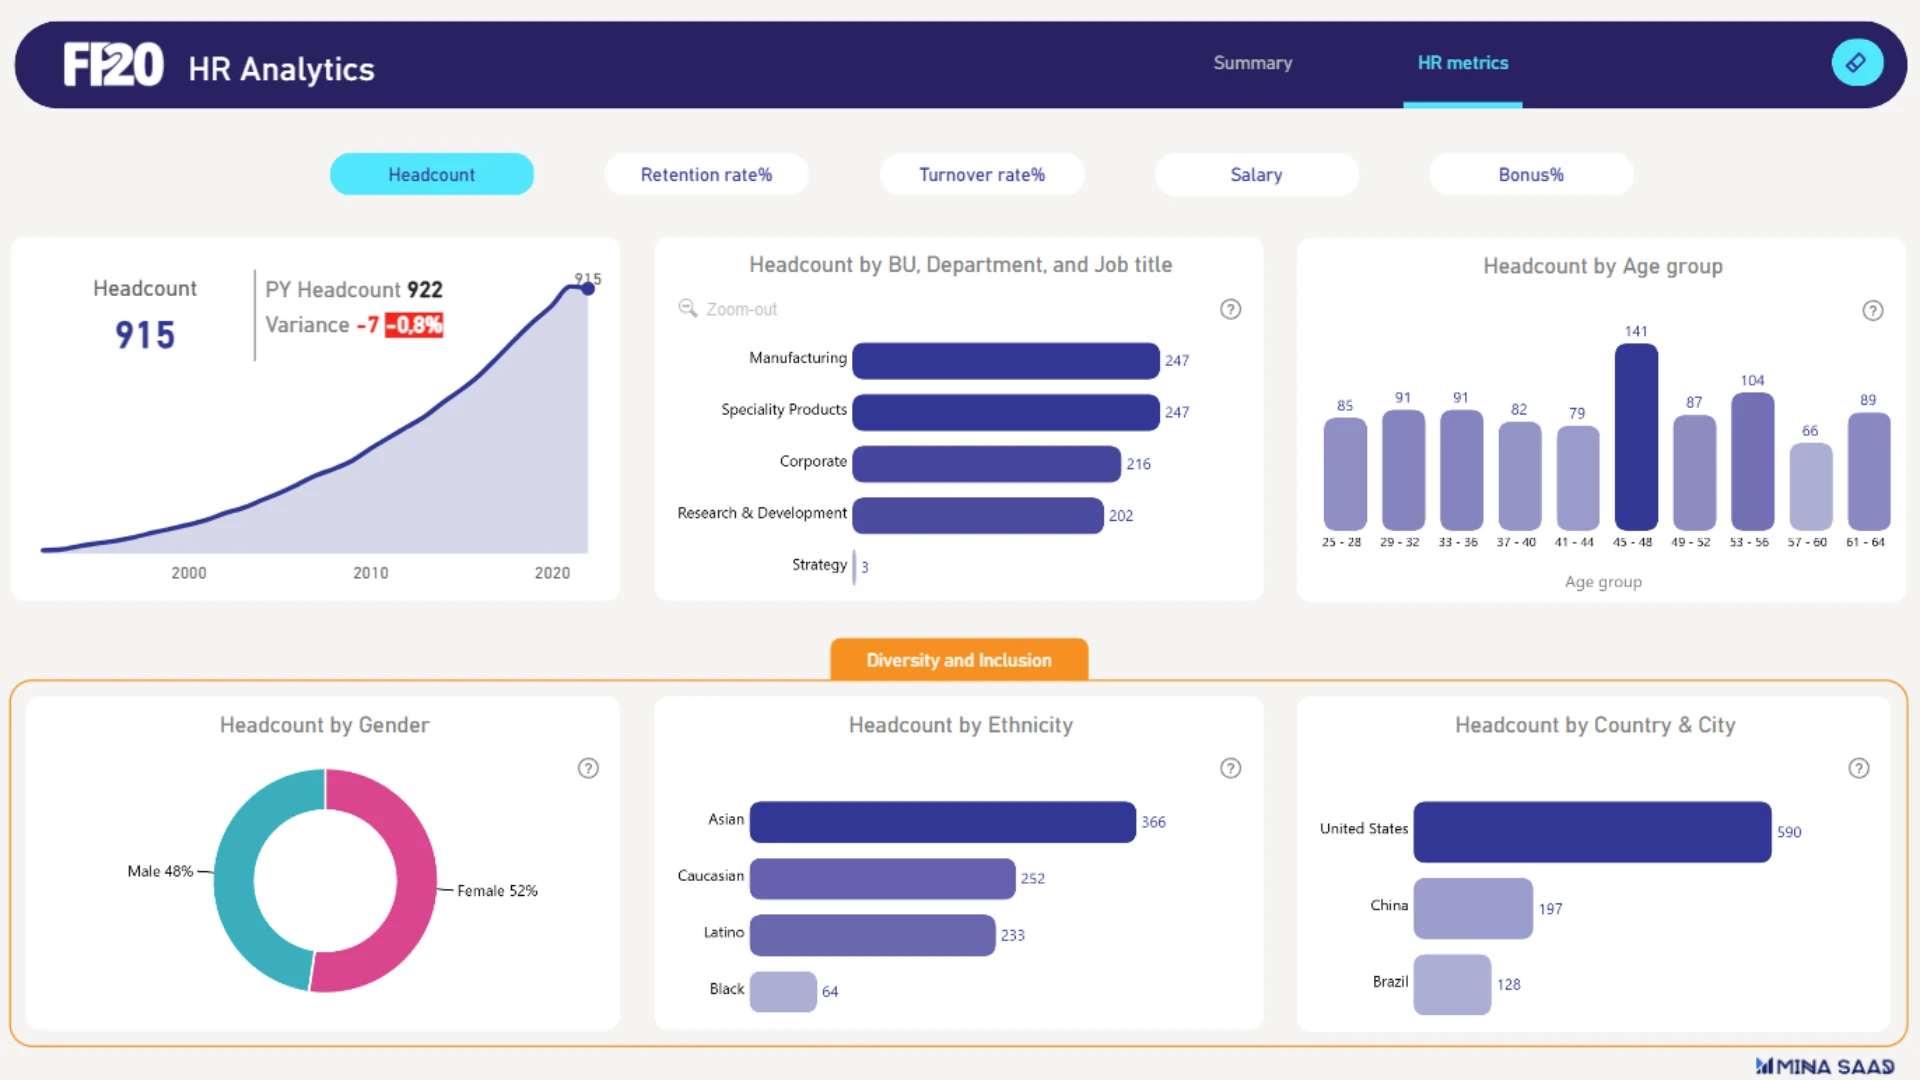
- Employee demographics: compare HR metrics by gender, age group, and ethnicity
- Workforce location: explore differences across employee locations
The dashboard uses combo, combo bar, timeline, and donut visuals with dynamic cross-filtering. Selecting a gender, age group, or another active data point filters the remaining visuals, allowing users to analyze workforce data from multiple perspectives.
This HR dashboard example is based on Mina Saad's challenge entry with minor refinements by the ZoomCharts team. See the original FP20 HR Analytics submission.
How to Use This HR Analytics Dashboard Template
Click any active chart element to filter the report. For example, select a gender in the donut chart or an age group in the combo chart to update the other visuals and focus the analysis on that employee group.
Download the .pbix file to review the report settings, formulas, calculations, and interactions. Replace the sample data with your own to customize this Power BI HR dashboard template for workforce reporting.
ZoomCharts visuals used




4U Report Challenges
Participate in data challenges, build and submit reports to get free template downloads.
Join CommunityMobile view allows you to interact with the report. To Download the template please switch to desktop view.
How to use a PBIX template
Preview the interactive report, download the PBIX file, open it in Power BI Desktop, and replace the same data connection with your own dataset.
Preview and download
Explore the report online and download the PBIX template file.
Open in Power BI Desktop
Open the downloaded PBIX file in Power BI Desktop.
Connect your data
Replace the sample data source with your own dataset.
Refresh and adjust
Refresh the model and update fields or visual were needed.
Save and share
Save your report and publish it for your audience.


