245
Hospital Bed Occupancy Power BI Dashboard
Hospital Bed Occupancy Power BI Dashboard
More Report pages
Report Author: Adewumi Oluokun
245
Share template with others
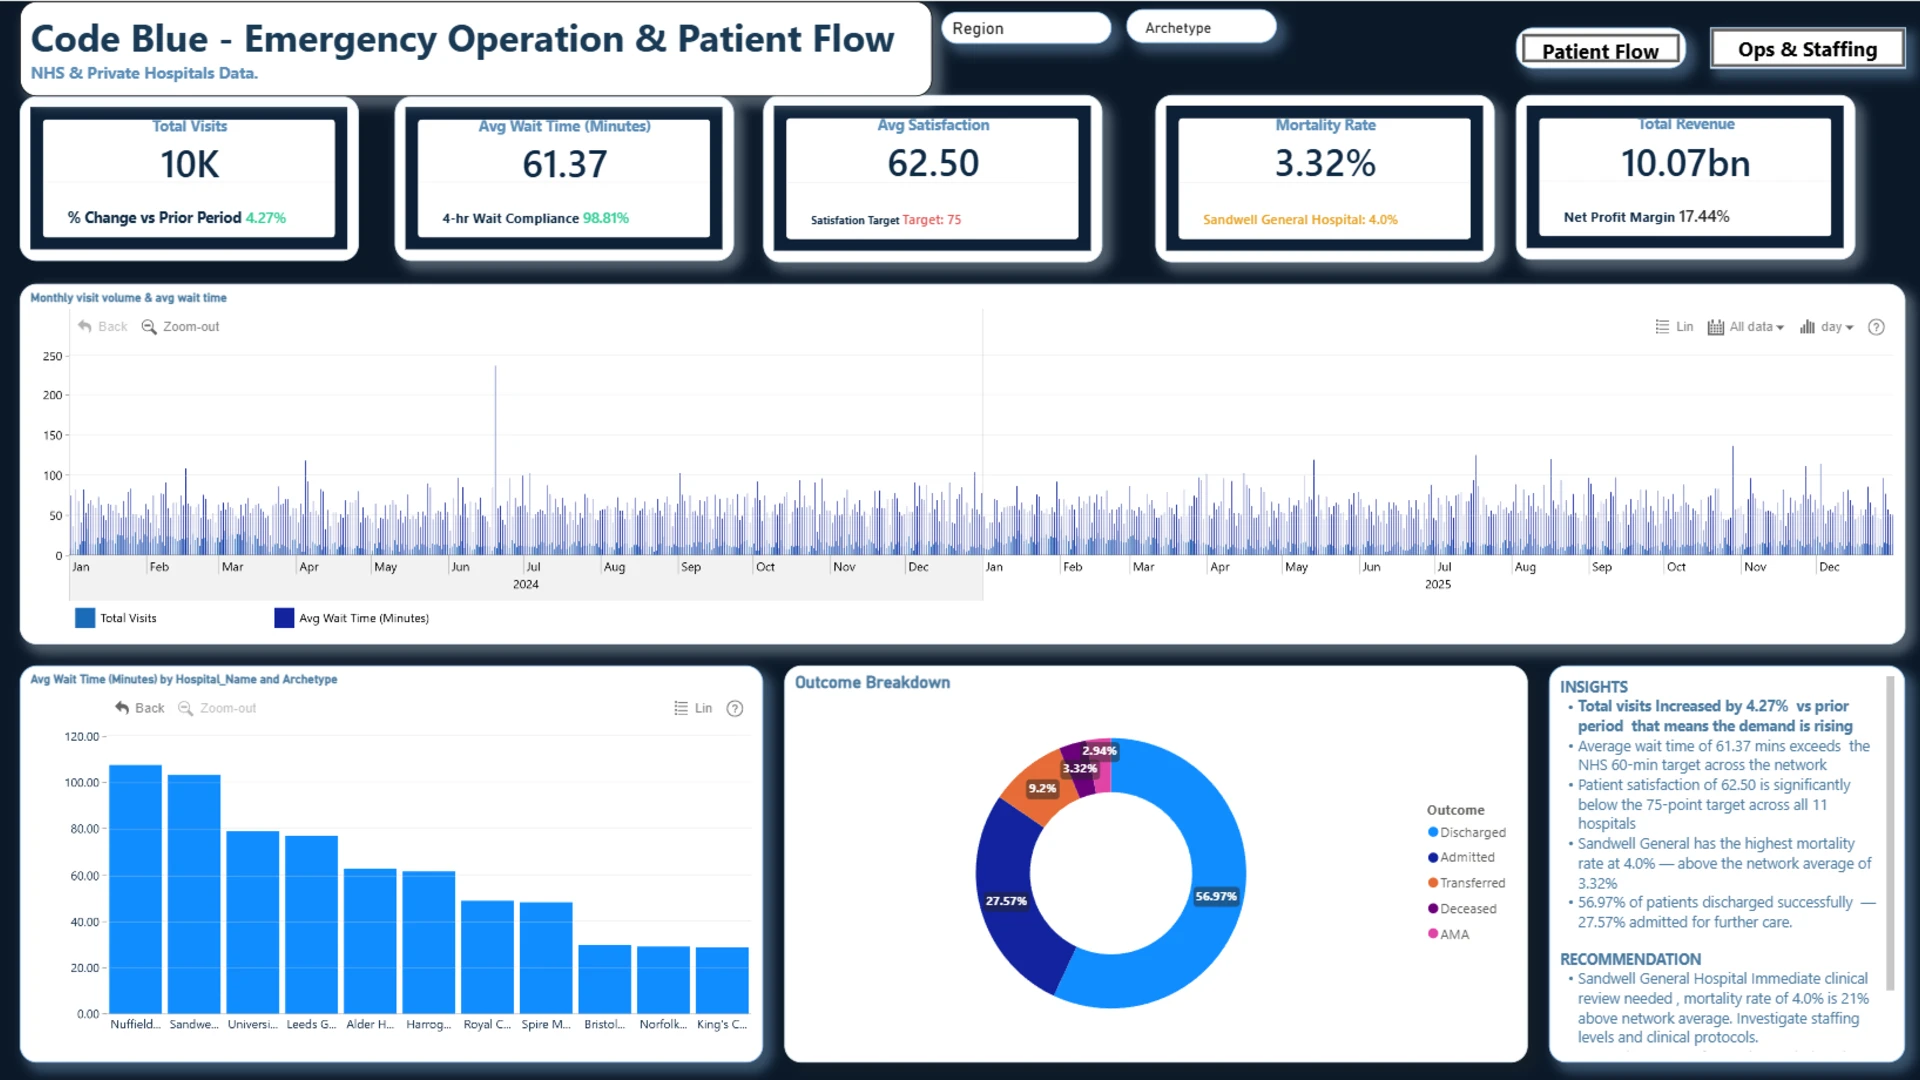
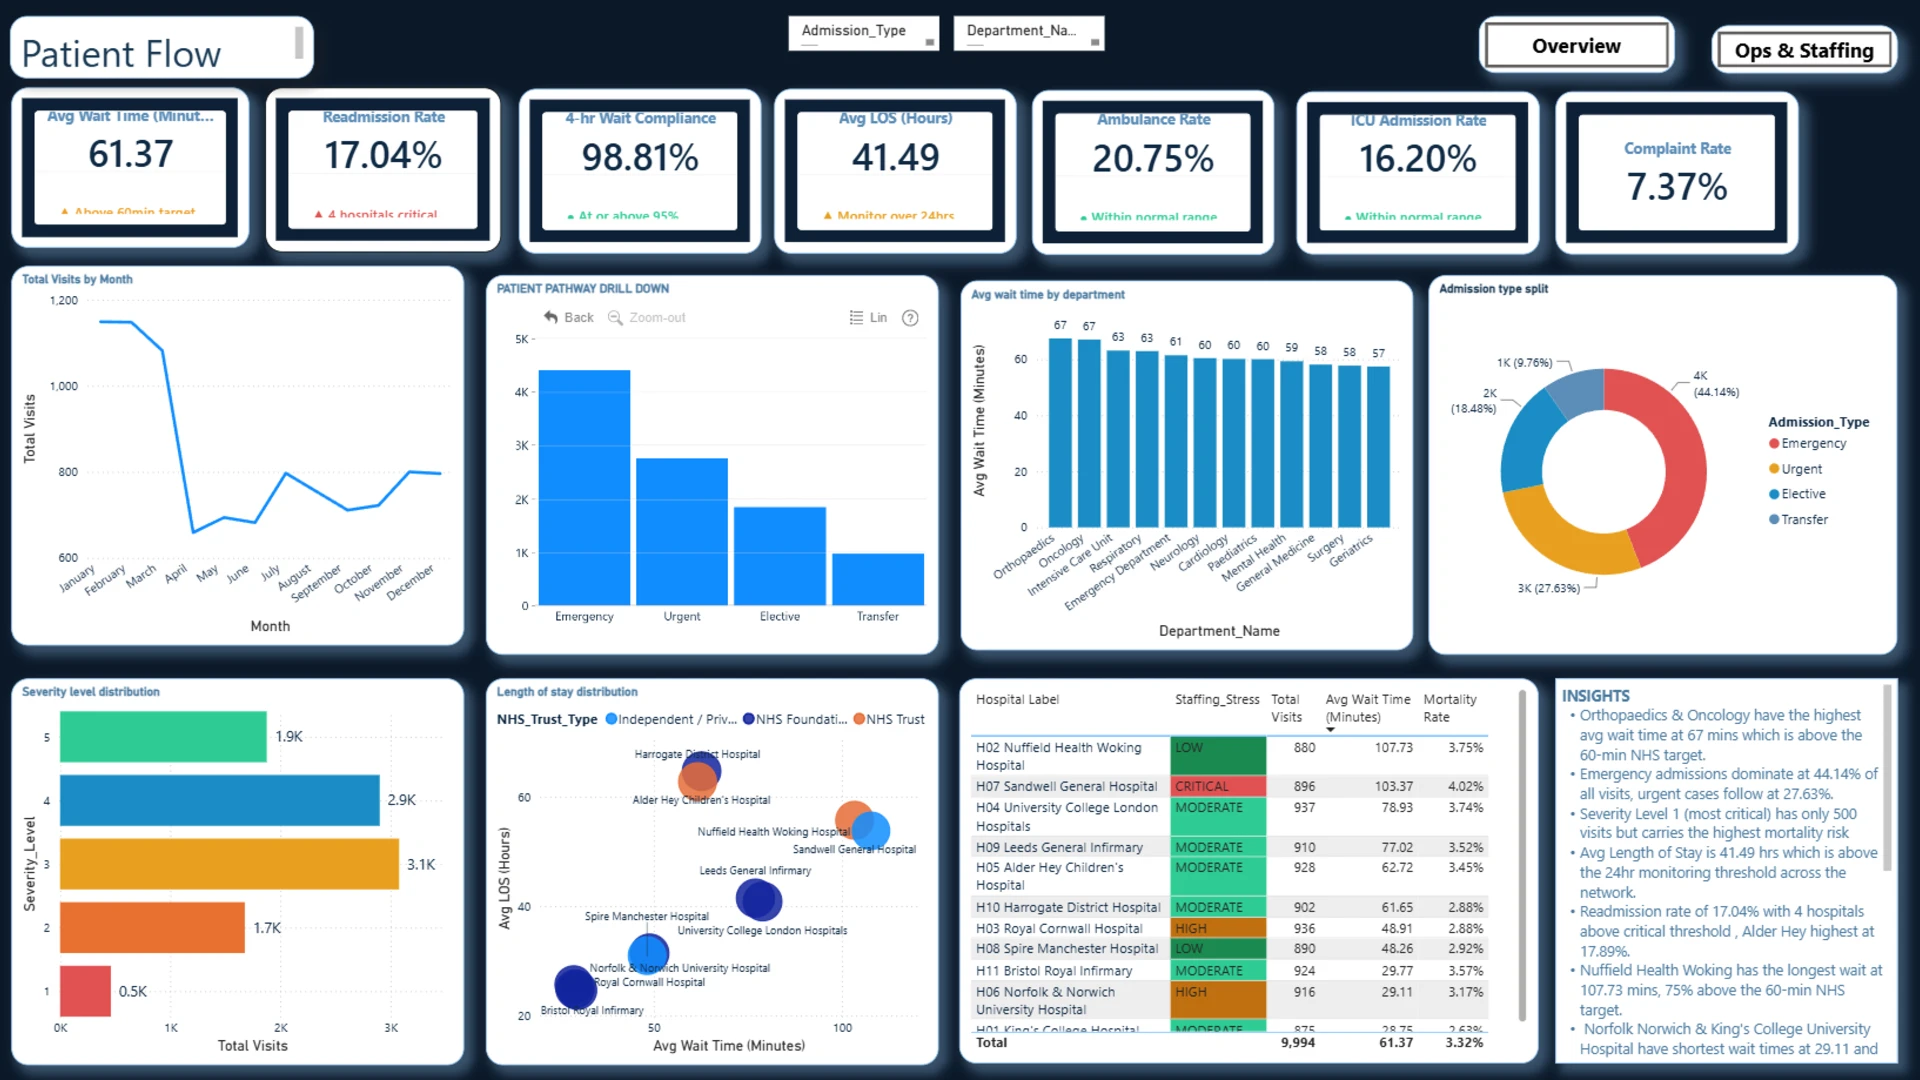
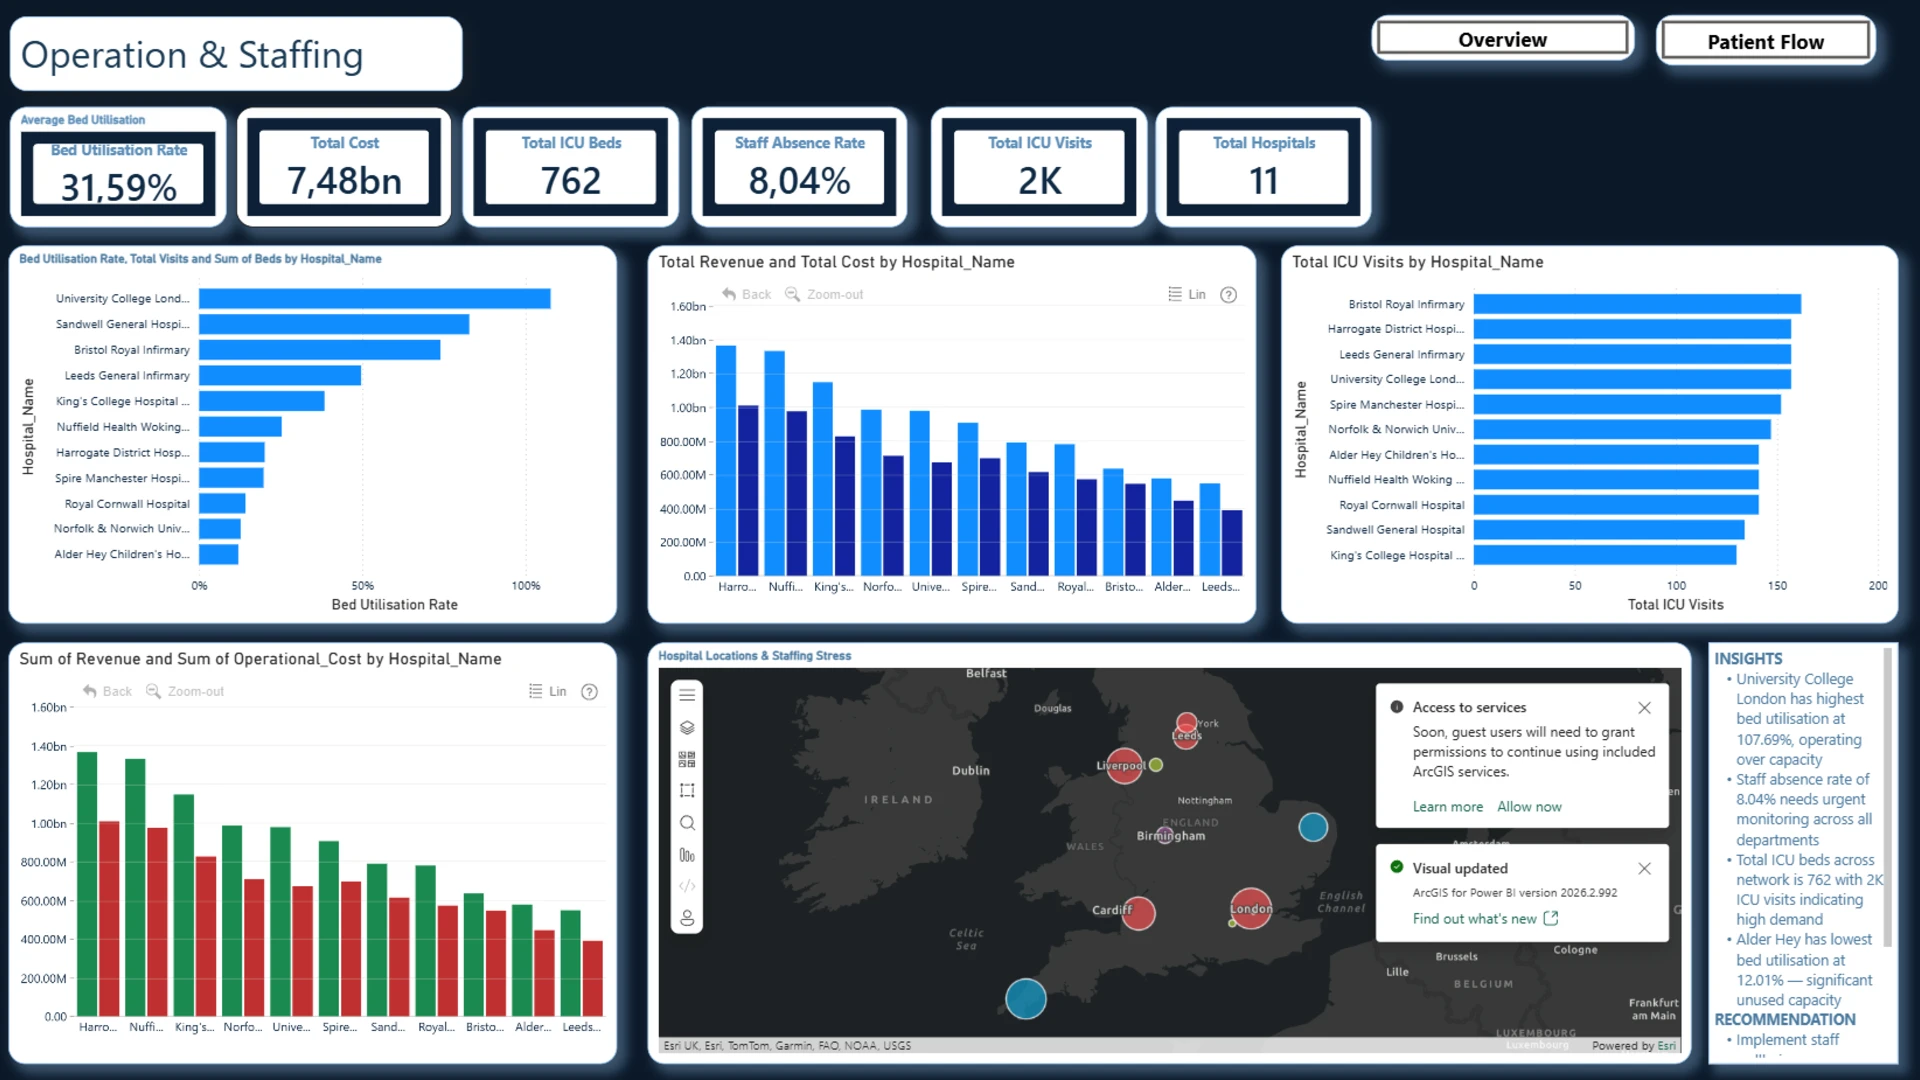
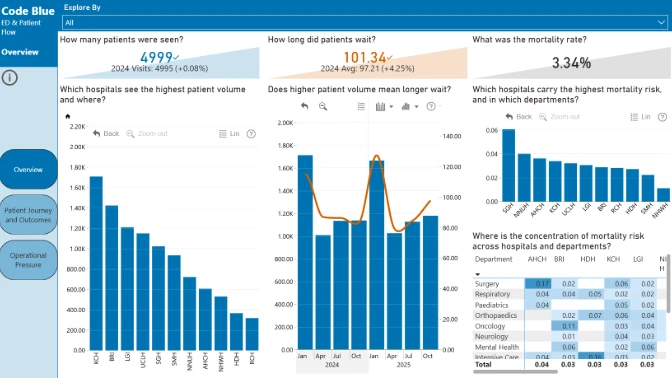
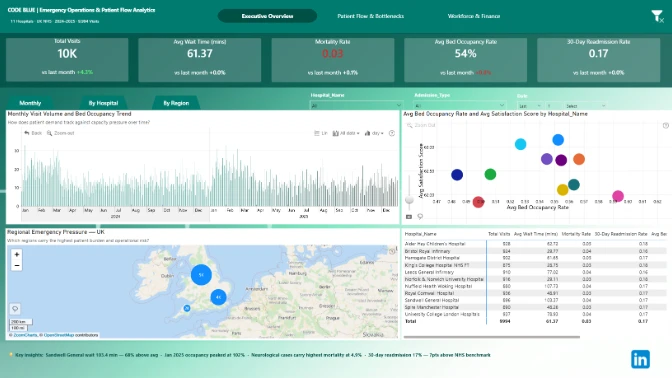
This interactive Power BI report explores the Code Blue Emergency Operations & Patient Flow dataset. It analyzes hospital performance, patient flow, bed capacity, emergency operations, pressure points, risks, inefficiencies, and outcome factors across hospitals and key healthcare segments.
Submitted to the FP20 Analytics ZoomCharts Data Challenge 38: Emergency Operations & Patient Flow Analytics, using native Power BI visuals and ZoomCharts Drill Down PRO custom visuals.
Author’s Description:
Code Blue: Emergency Operations & Patient Flow Analytics.A three-page interactive Power BI dashboard analyzing emergency department operations and patient flow across 11 NHS and private hospitals in England during 2024–2025. The report combines interactive ZoomCharts drill-down visuals, dynamic KPI cards, ArcGIS mapping, advanced DAX calculations, time intelligence, field parameters, and conditional formatting to help healthcare leaders explore performance from a network-wide overview down to individual hospitals and care groups. Designed as an executive decision-support solution, it transforms complex operational data into clear, actionable insights for improving patient flow, resource planning, and emergency care performance.
4U Report Challenges
Participate in data challenges, build and submit reports to get free template downloads.
Join CommunityMobile view allows you to interact with the report. To Download the template please switch to desktop view.

Was this helpful? Thank you for your feedback!
Sorry about that.
How can we improve it?