627
Holiday Campaign Performance – Power BI 4
Holiday Campaign Performance – Power BI 4
Report Author: Dipika Chhabria
627
Share template with others
This Power BI report is built using the Omnichannel Holiday Retail Sales dataset and features ZoomCharts Drill Down PRO custom visuals for Power BI. It was submitted to the FP20 Analytics ZoomCharts Data Challenge #33 (December 2025 – January 2026).
Author's Description:
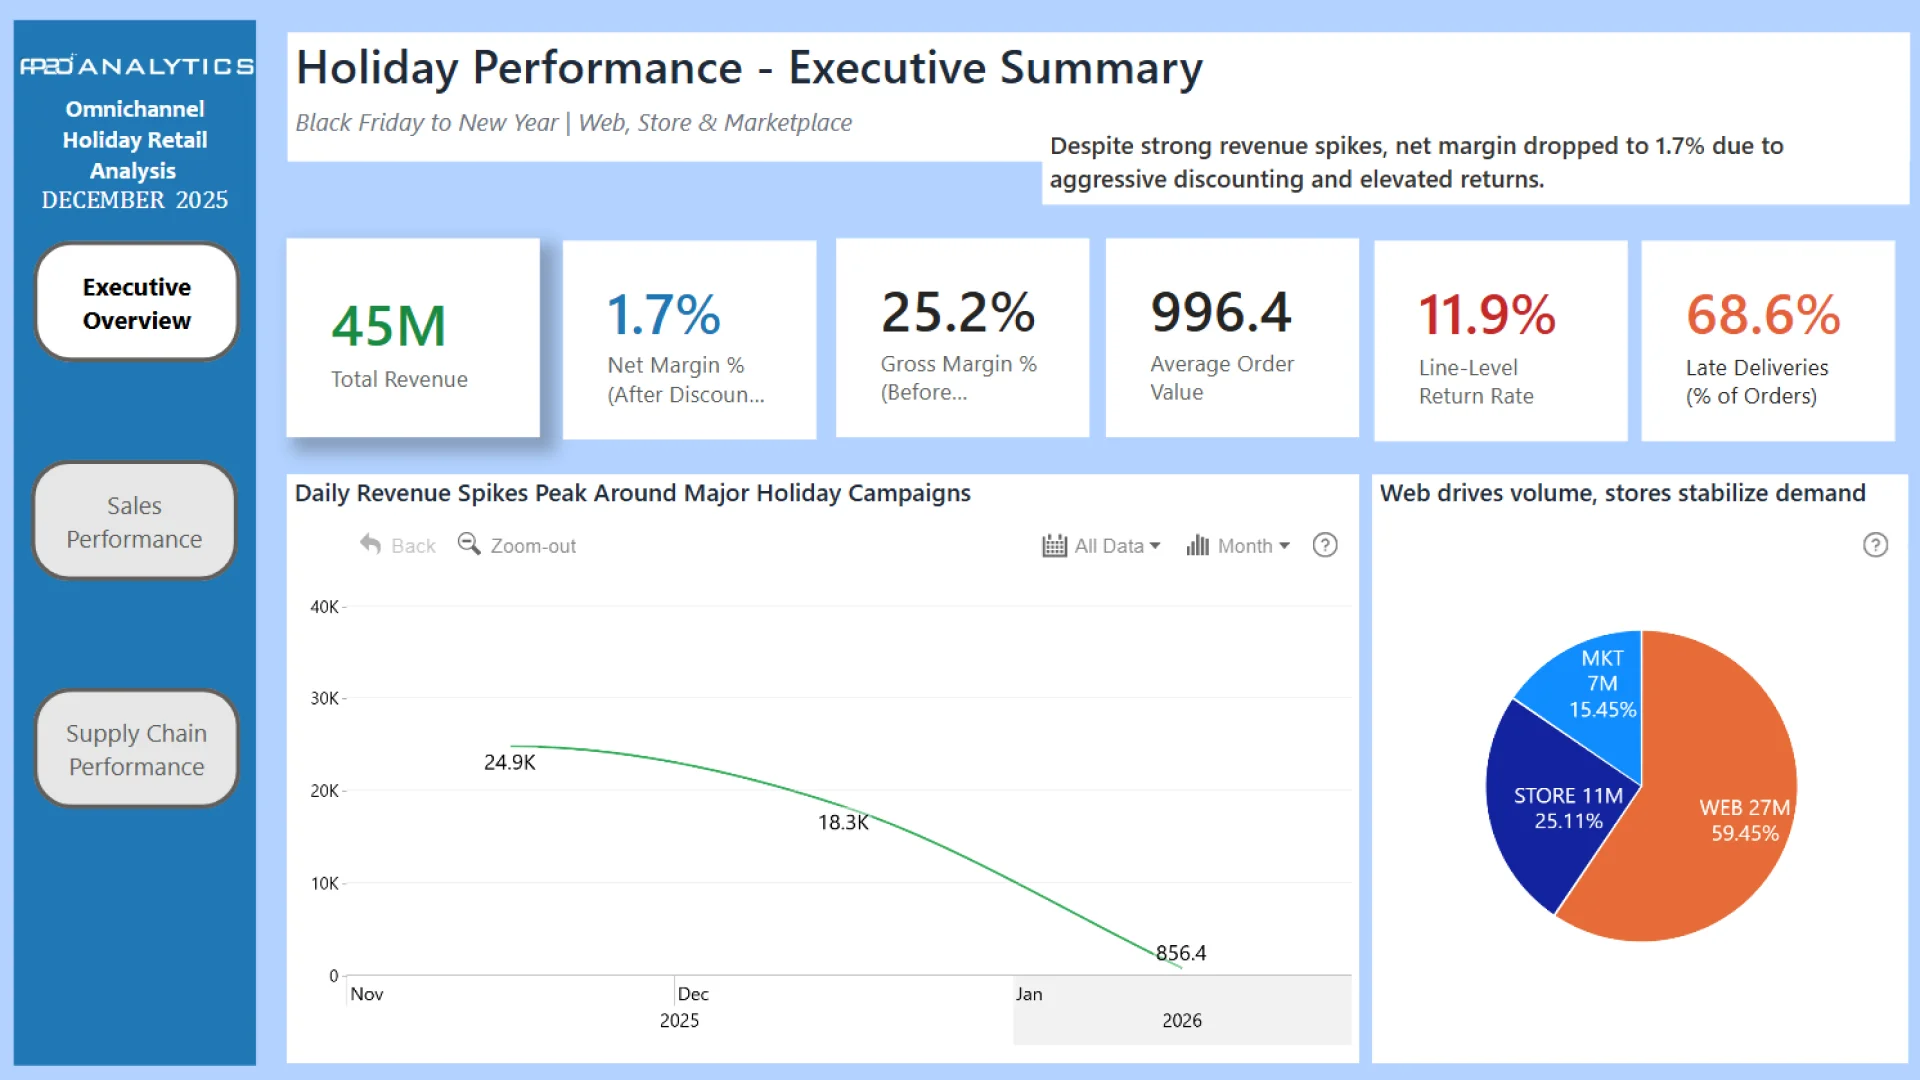
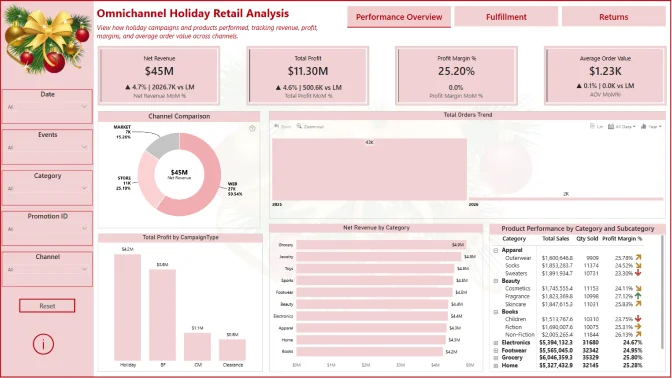
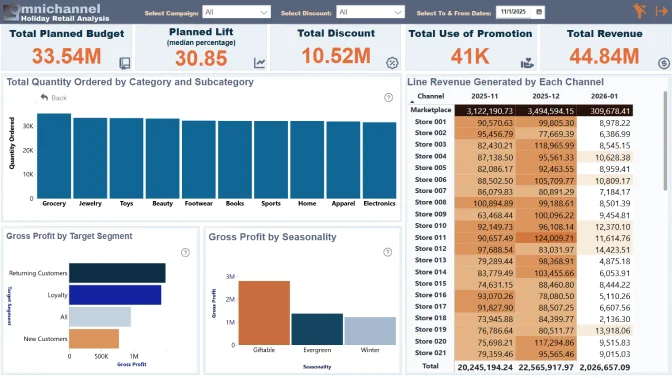
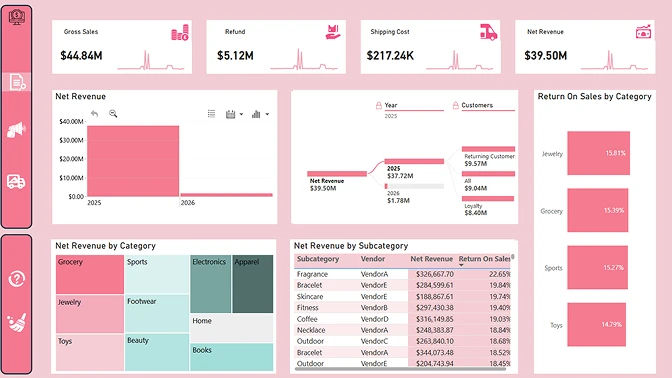
This Power BI report analyzes festive-season retail performance from Black Friday to New Year across Web, Store, and Marketplace channels. The report leverages ZoomCharts Drill Down visuals, including a Time Series analysis of daily revenue spikes and an interactive channel contribution breakdown, to explore trends, volatility, and demand shifts during peak holiday campaigns. The focus is on translating sales patterns into business-relevant insights around revenue concentration, promotional intensity, and operational pressure during the Christmas season.
4U Report Challenges
Participate in data challenges, build and submit reports to get free template downloads.
Join CommunityMobile view allows you to interact with the report. To Download the template please switch to desktop view.
Was this helpful? Thank you for your feedback!
Sorry about that.
How can we improve it?