188
Healthcare Operations Performance Dashboard
Healthcare Operations Performance Dashboard
More Report pages
Report Author: Ivan Baldin
188
Share template with others
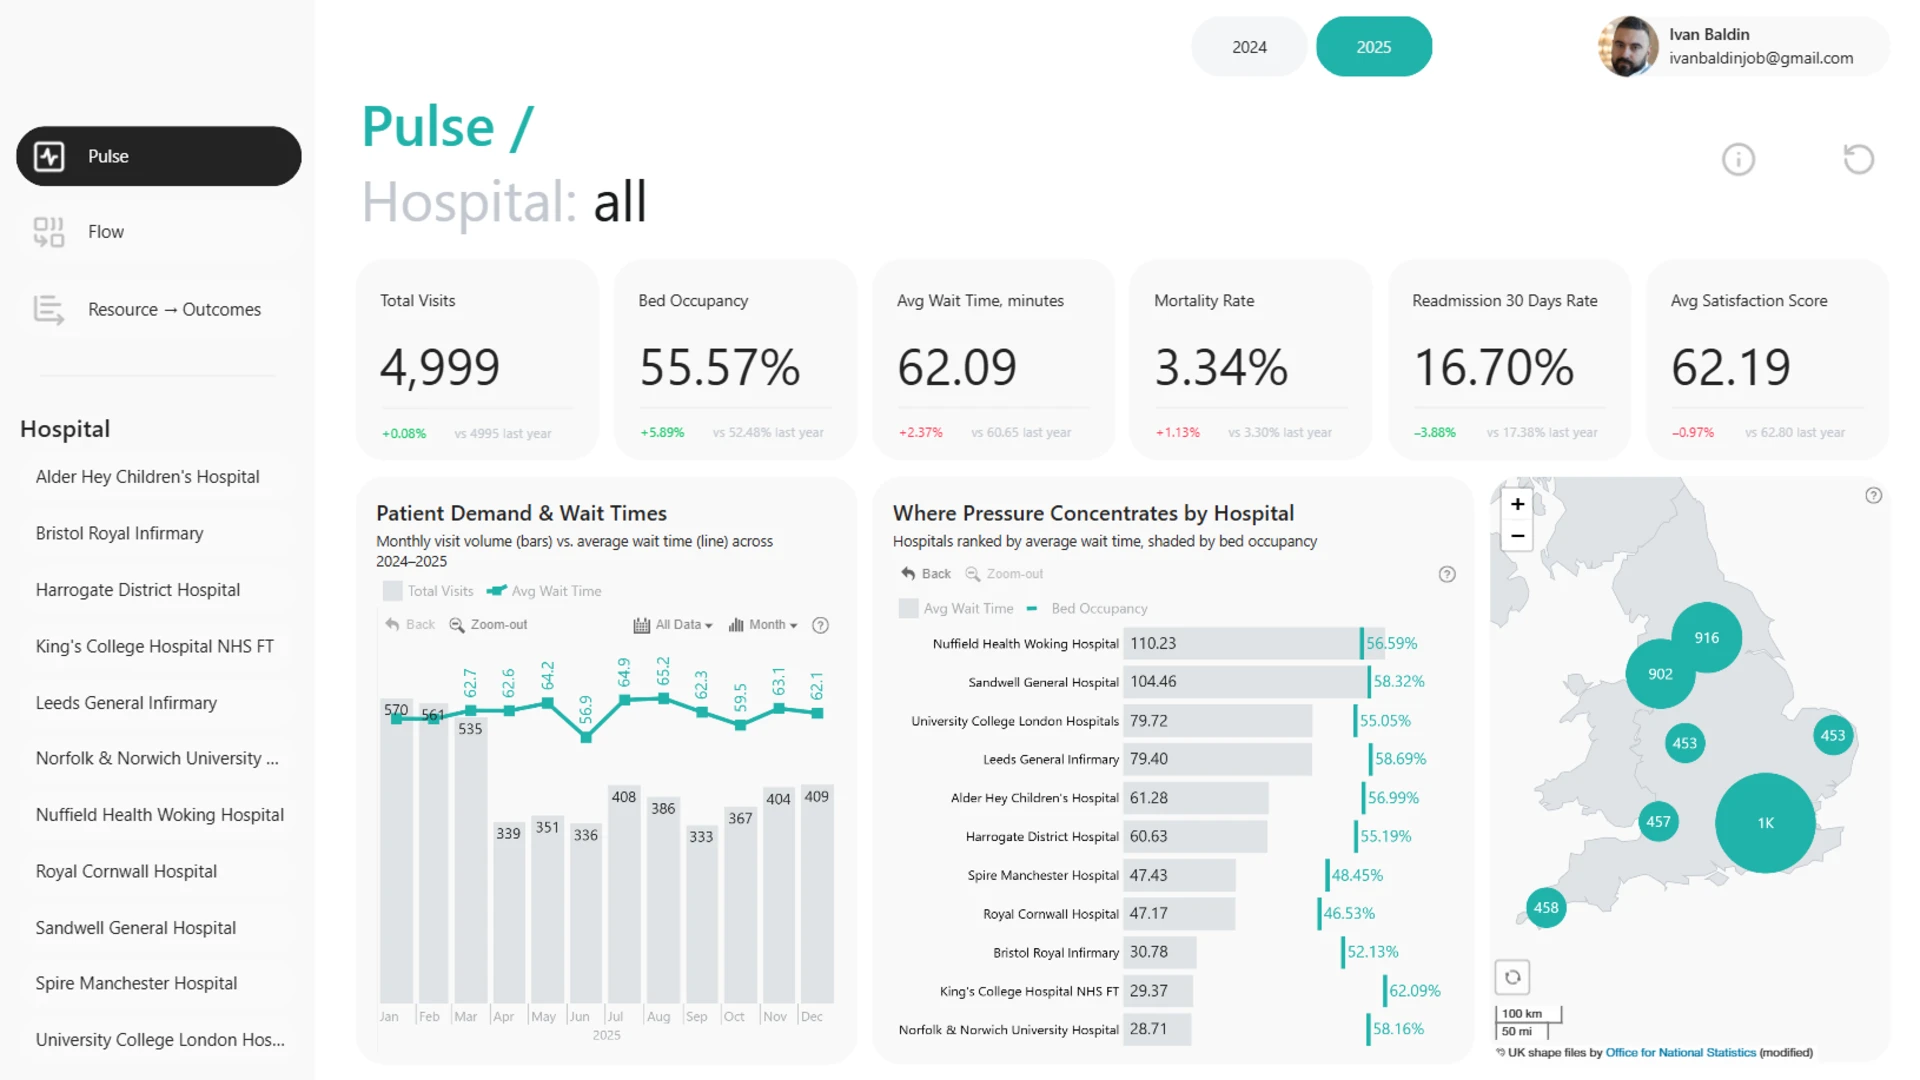
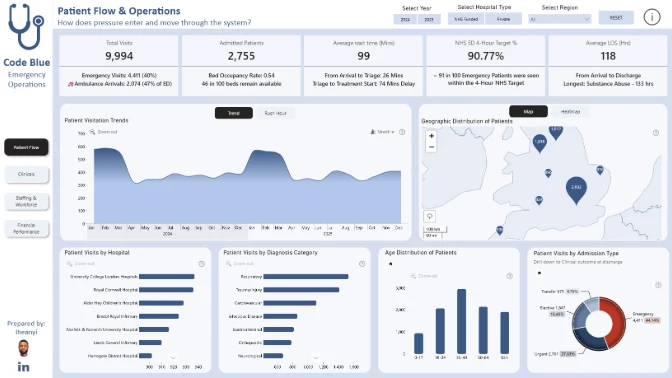
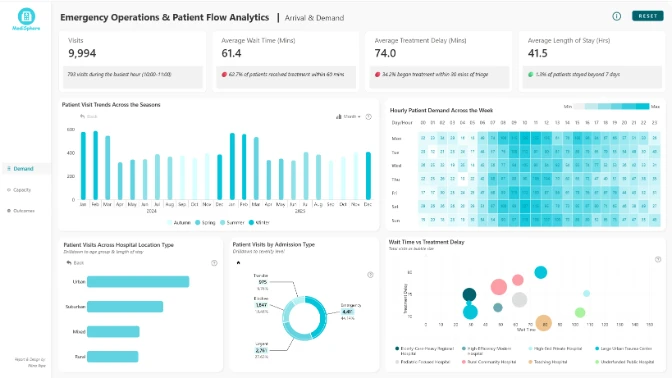
This interactive Power BI report explores the Code Blue Emergency Operations & Patient Flow dataset. It analyzes hospital performance, patient flow, bed capacity, emergency operations, pressure points, risks, inefficiencies, and outcome factors across hospitals and key healthcare segments.
Submitted to the FP20 Analytics ZoomCharts Data Challenge 38: Emergency Operations & Patient Flow Analytics, using native Power BI visuals and ZoomCharts Drill Down PRO custom visuals.
Author’s Description:
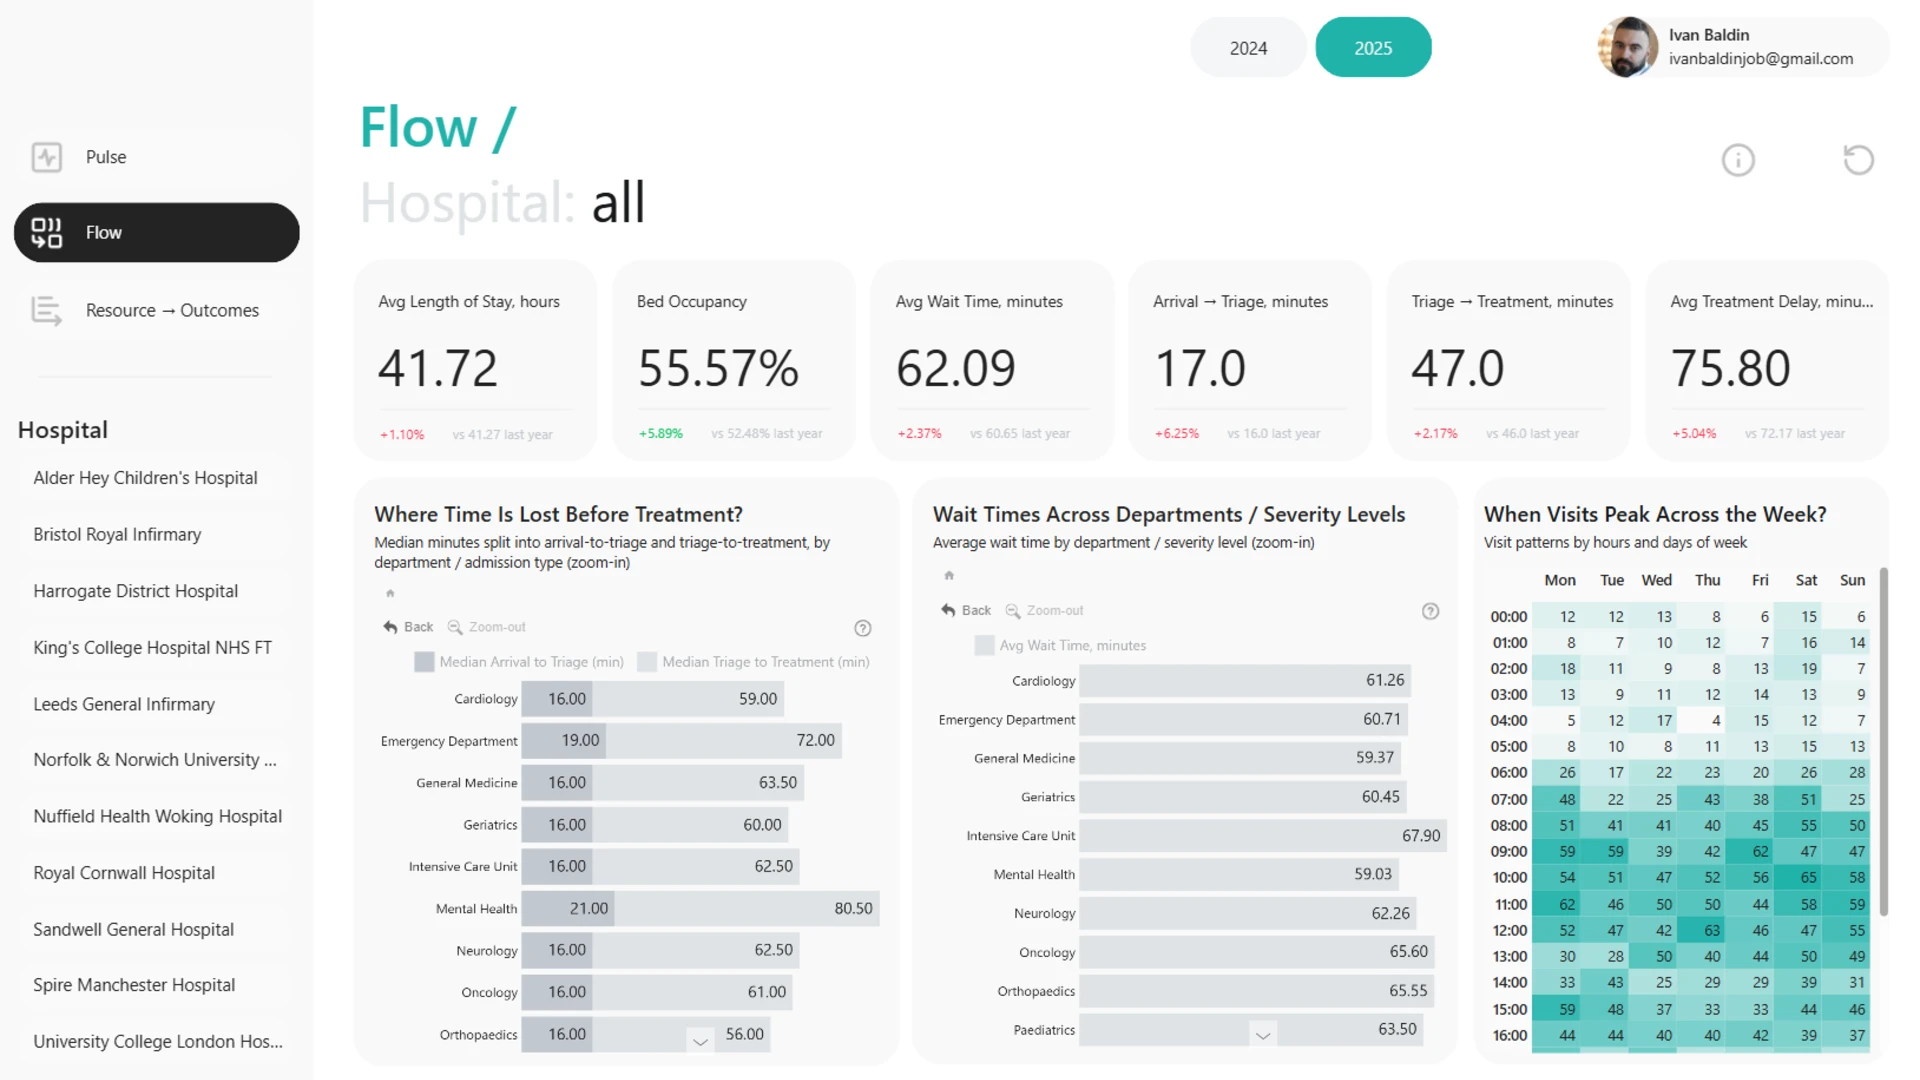
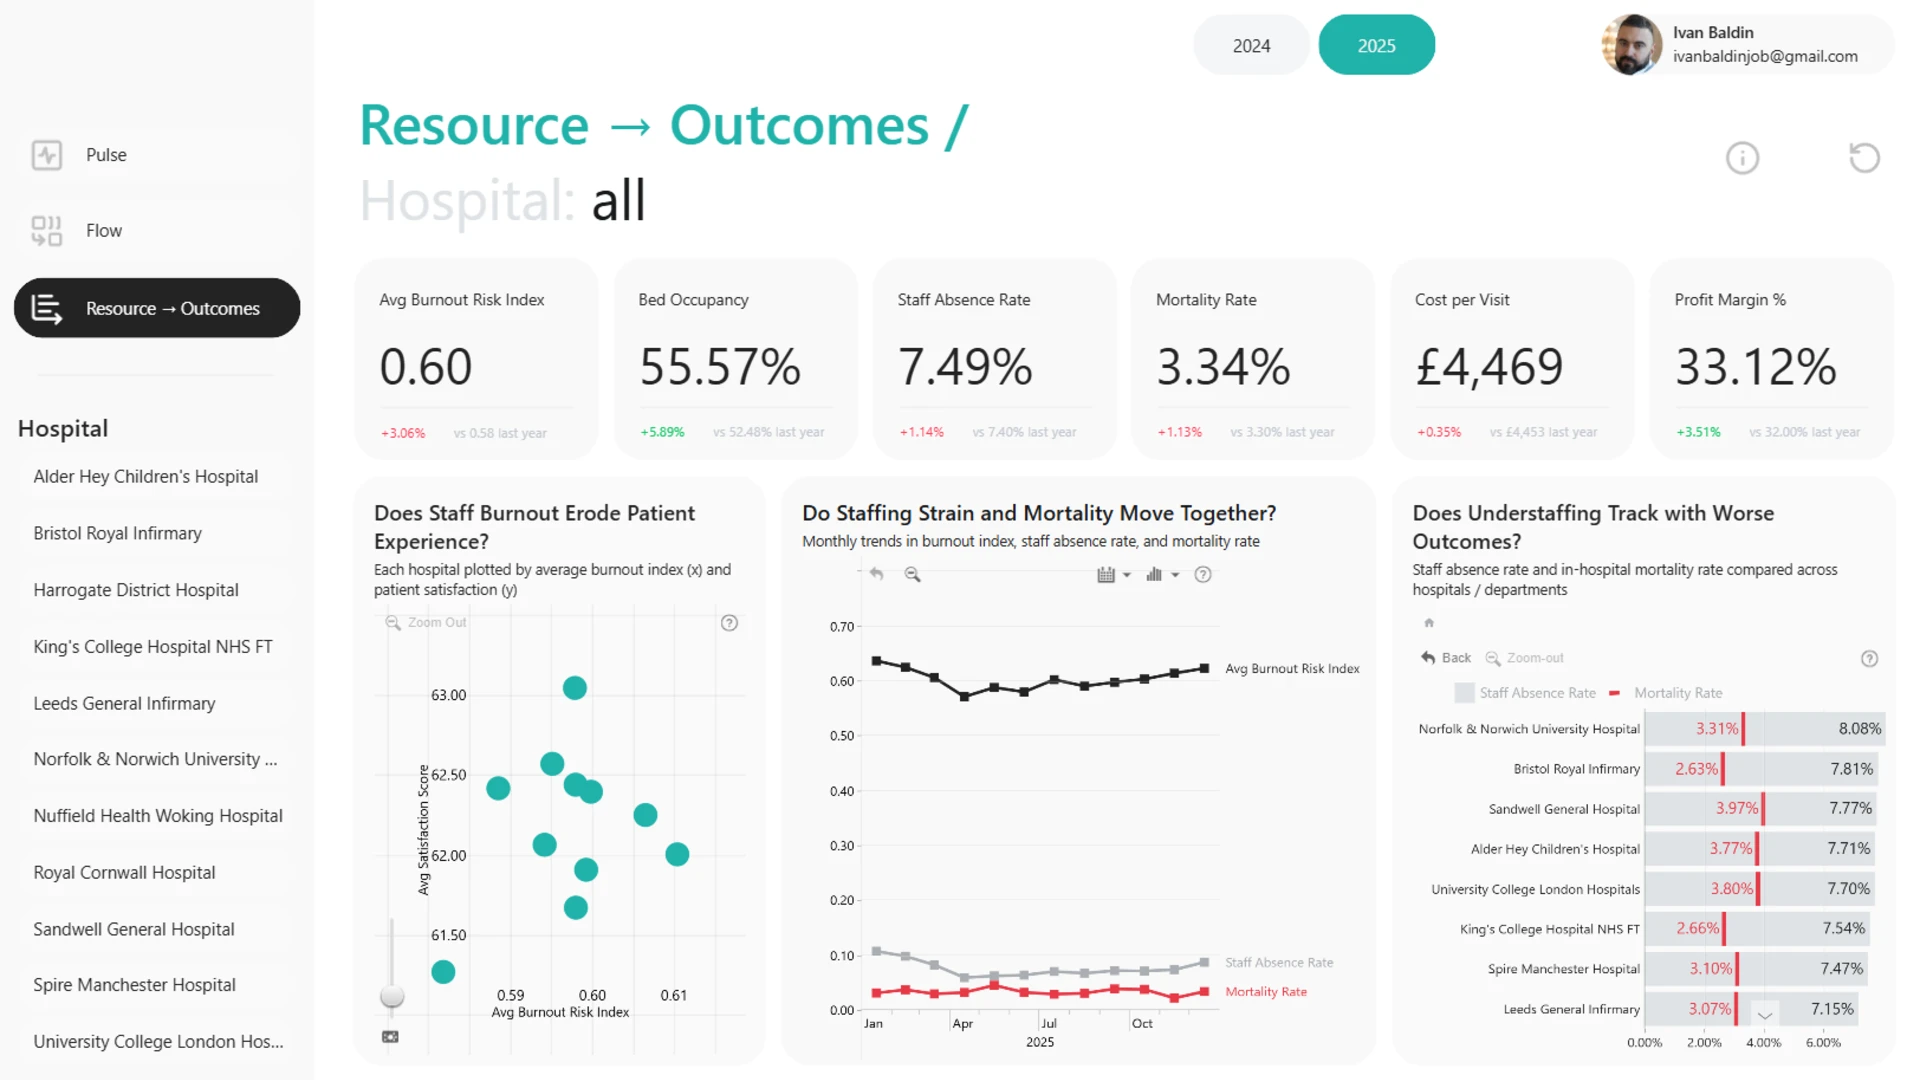
An interactive Power BI report analyzing emergency care across 11 UK hospitals over two years (2024–2025). It follows the patient journey from arrival to discharge – showing where demand peaks, where the flow bottlenecks, and how staffing strain and bed pressure connect to outcomes like wait times, satisfaction, and mortality. Designed to help hospital leaders spot pressure points and decide where to act first.
ZoomCharts visuals used
4U Report Challenges
Participate in data challenges, build and submit reports to get free template downloads.
Join CommunityMobile view allows you to interact with the report. To Download the template please switch to desktop view.
Was this helpful? Thank you for your feedback!
Sorry about that.
How can we improve it?