463
Hospital Capacity and Bed Utilization Dashboard
Hospital Capacity and Bed Utilization Dashboard
More Report pages
Report Author: Nina Ikpe
463
Share template with others
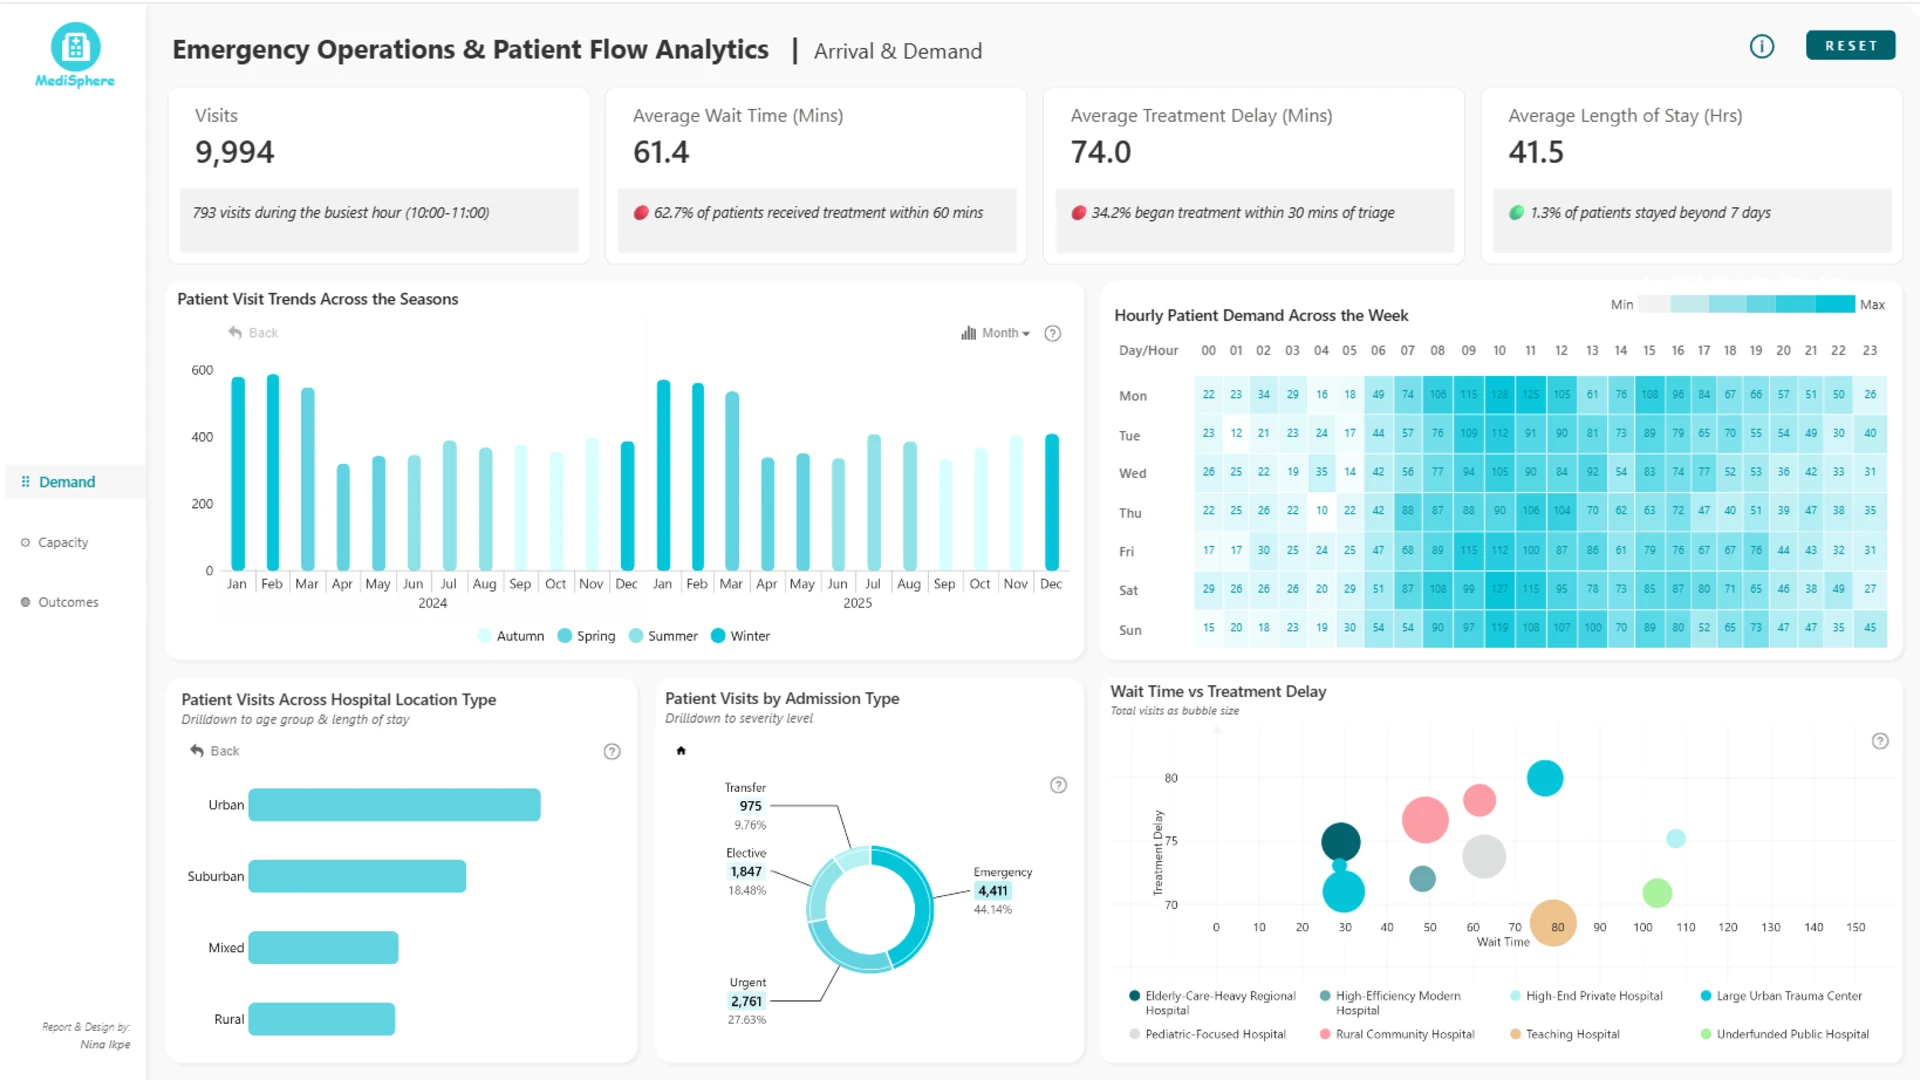
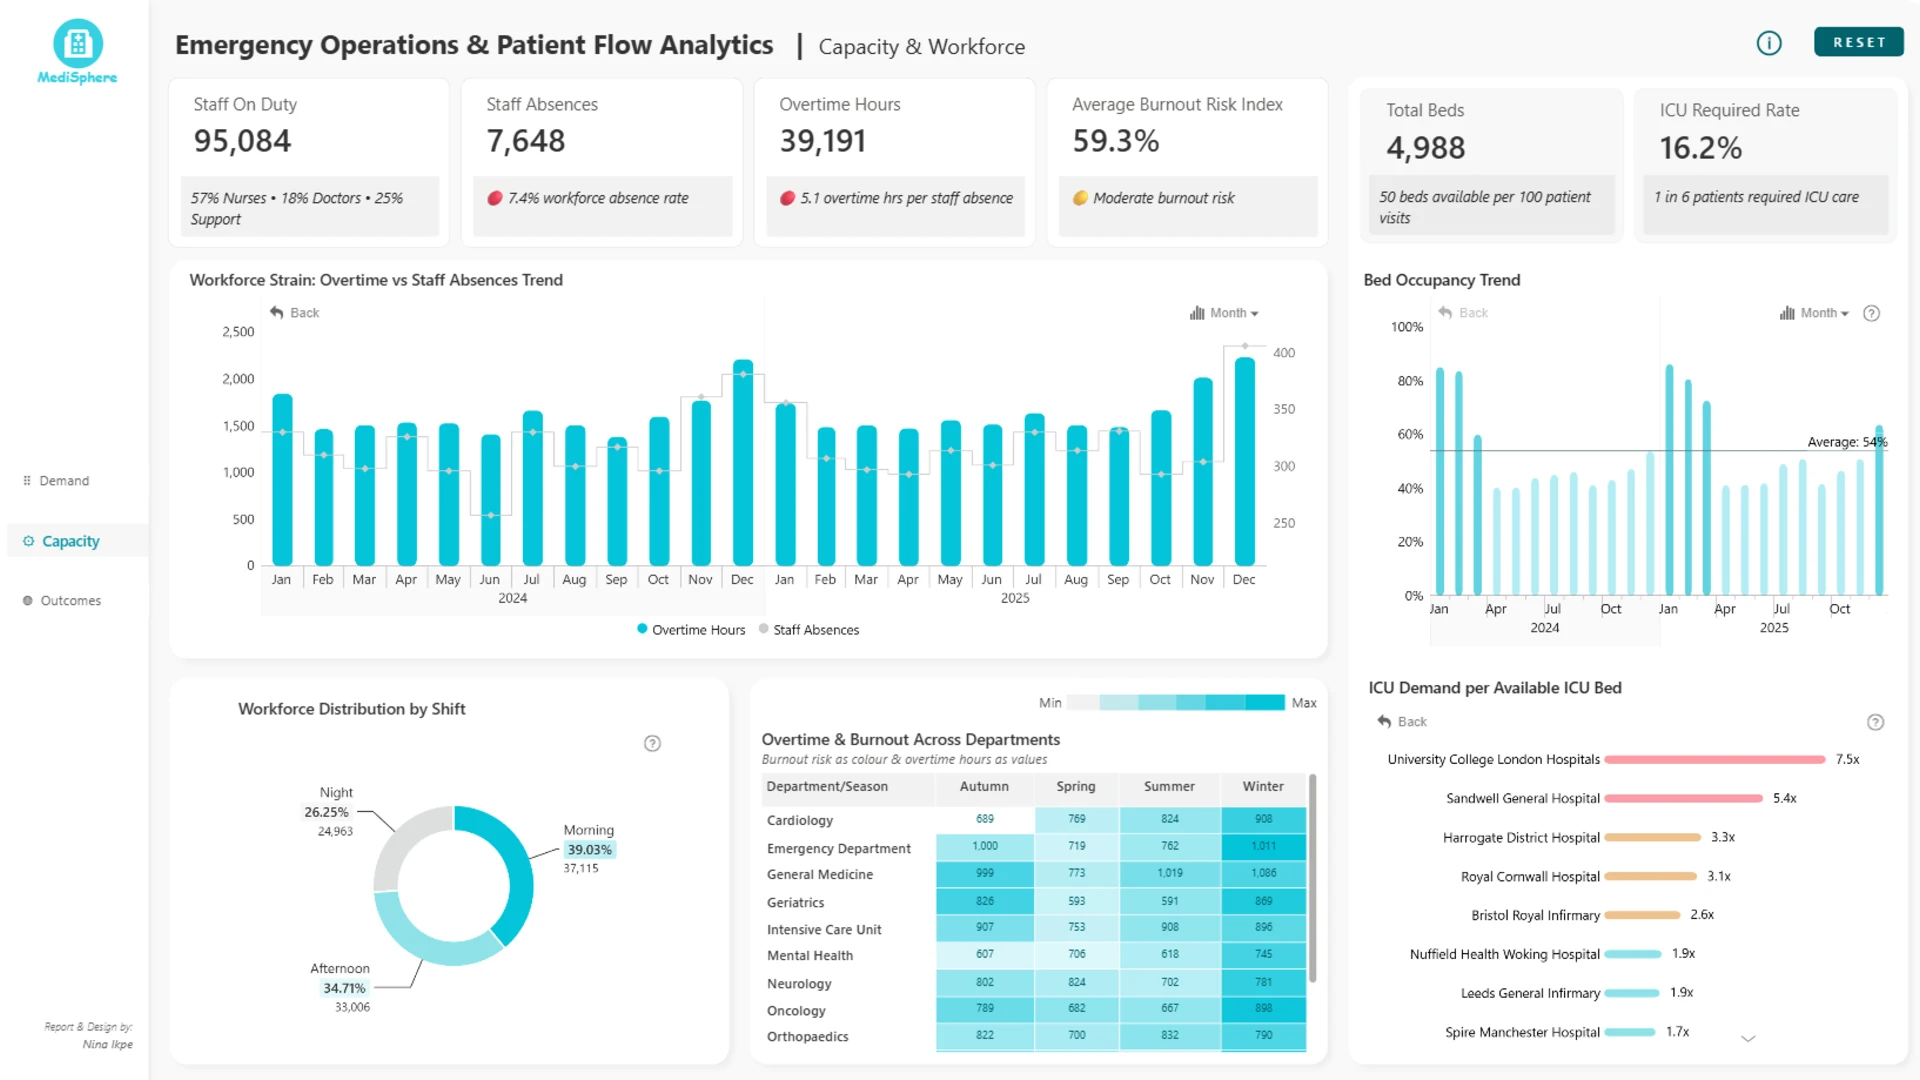
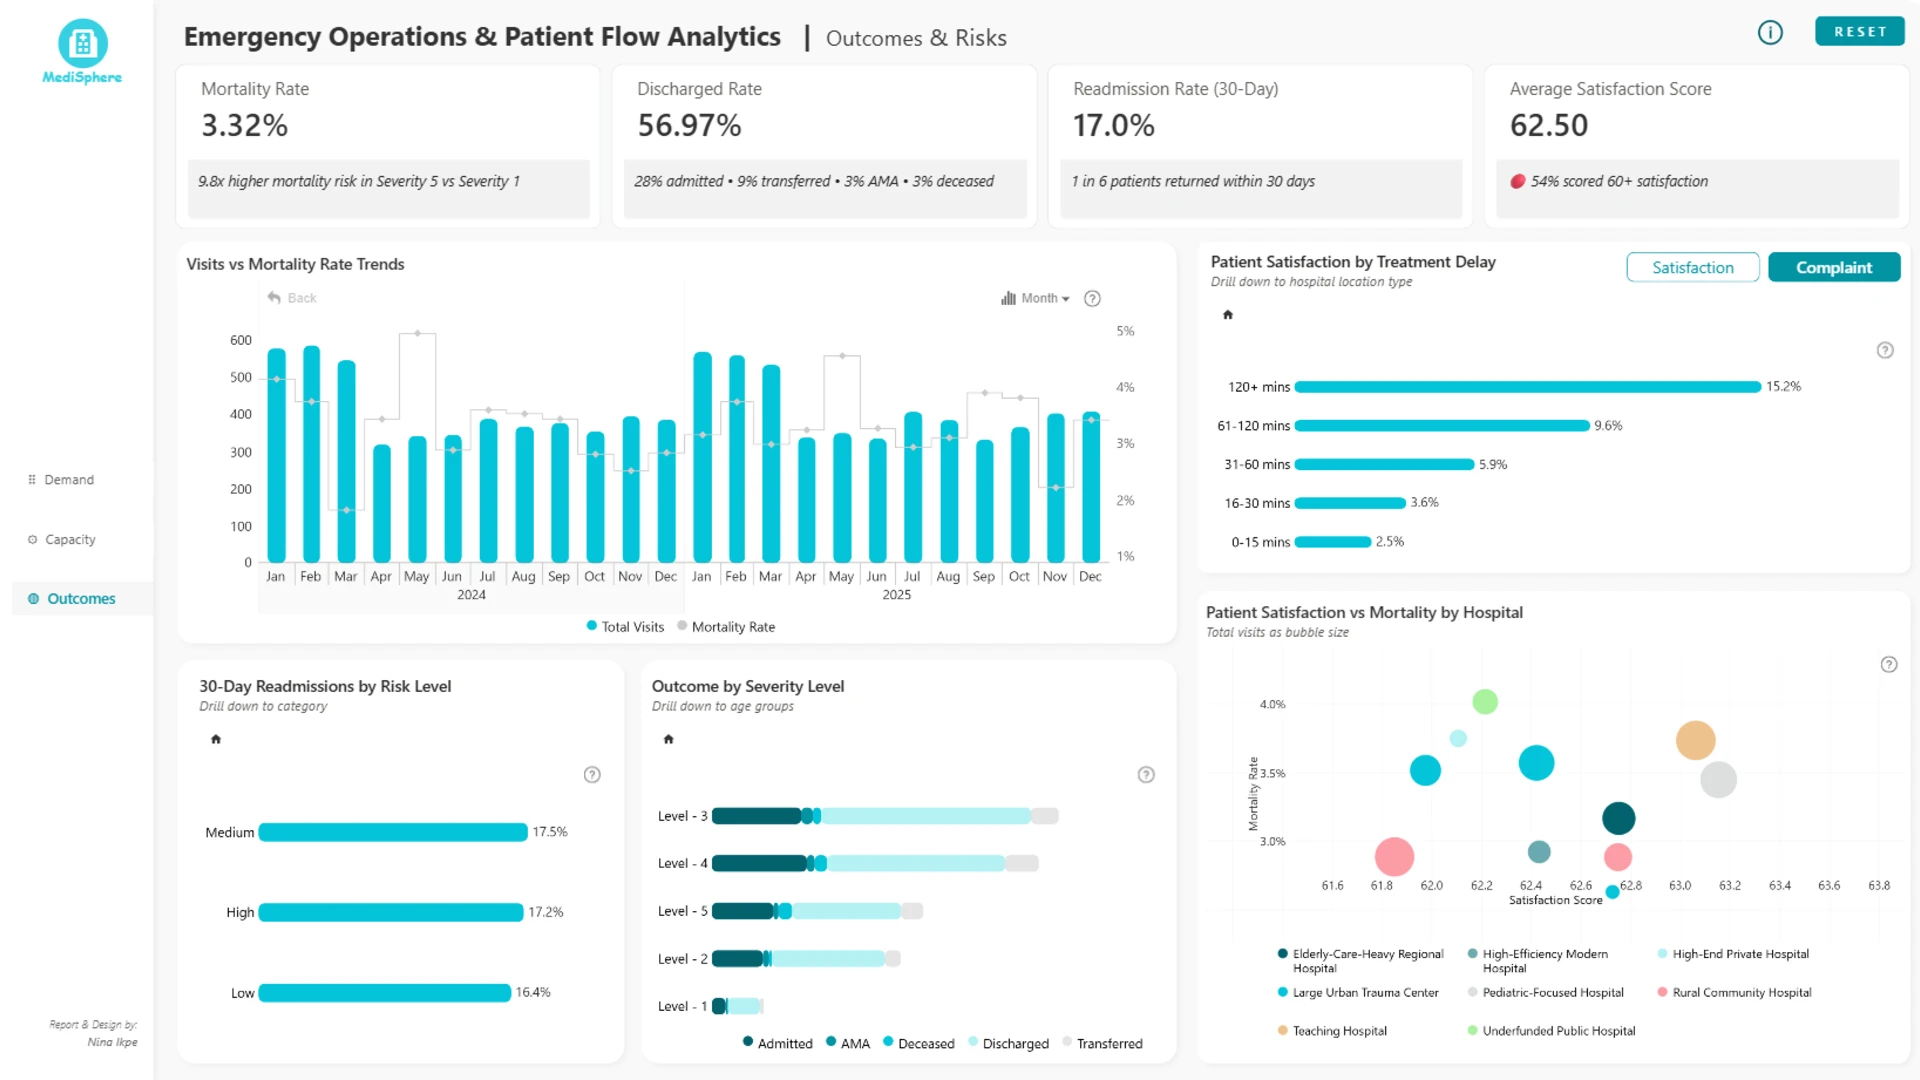
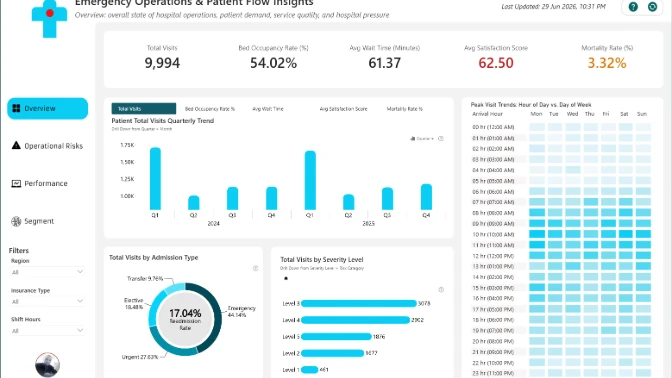
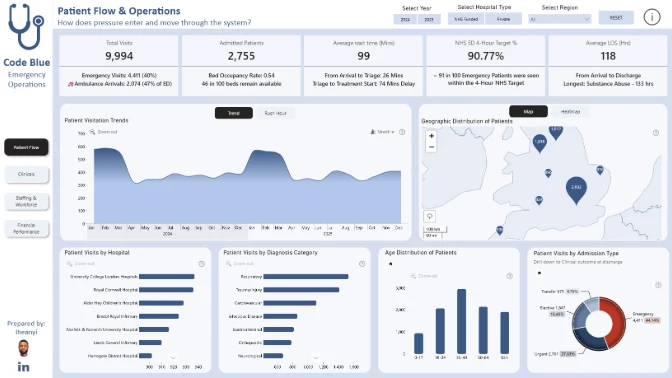
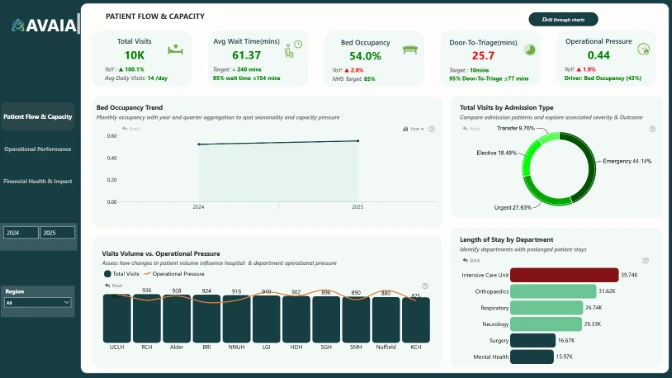
This interactive Power BI report explores the Code Blue Emergency Operations & Patient Flow dataset. It analyzes hospital performance, patient flow, bed capacity, emergency operations, pressure points, risks, inefficiencies, and outcome factors across hospitals and key healthcare segments.
Submitted to the FP20 Analytics ZoomCharts Data Challenge 38: Emergency Operations & Patient Flow Analytics, using native Power BI visuals and ZoomCharts Drill Down PRO custom visuals.
Author’s Description:
Every minute in an emergency department shapes patient outcomes. This report transforms emergency care data into actionable insights by connecting operational performance with the patient journey - from arrival and triage to treatment, staffing, and discharge. Organized into three analytical areas - Demand, Capacity, and Outcomes - it helps identify patient flow bottlenecks, evaluate workforce and resource utilization, and measure the impact of operational decisions on quality of care. By combining interactive analysis with meaningful performance benchmarks, the dashboard enables healthcare leaders to make faster, evidence-based decisions that improve patient flow, optimize resources, and enhance emergency care delivery.
ZoomCharts visuals used
4U Report Challenges
Participate in data challenges, build and submit reports to get free template downloads.
Join CommunityMobile view allows you to interact with the report. To Download the template please switch to desktop view.
Was this helpful? Thank you for your feedback!
Sorry about that.
How can we improve it?