516
Healthcare Operations Improvement Dashboard
Healthcare Operations Improvement Dashboard
More Report pages
Report Author: Eke Uma
516
Share template with others
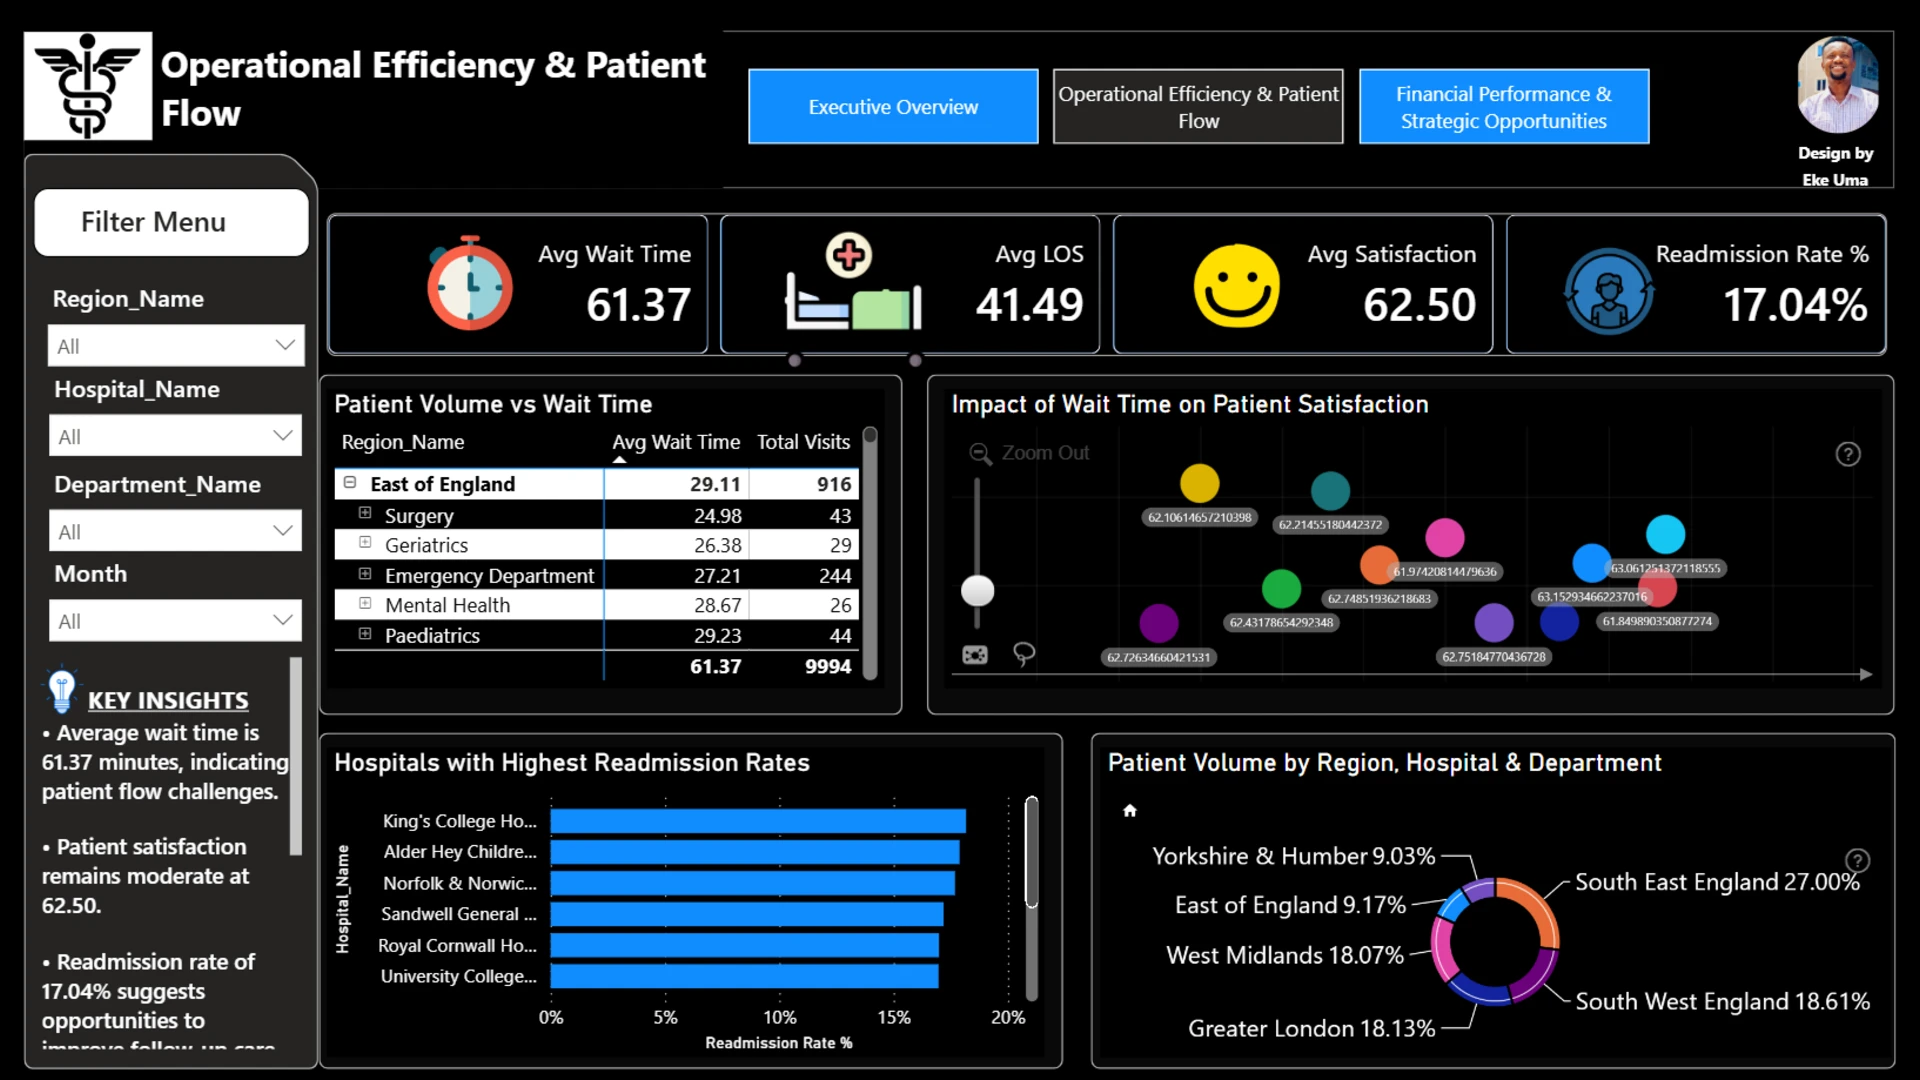
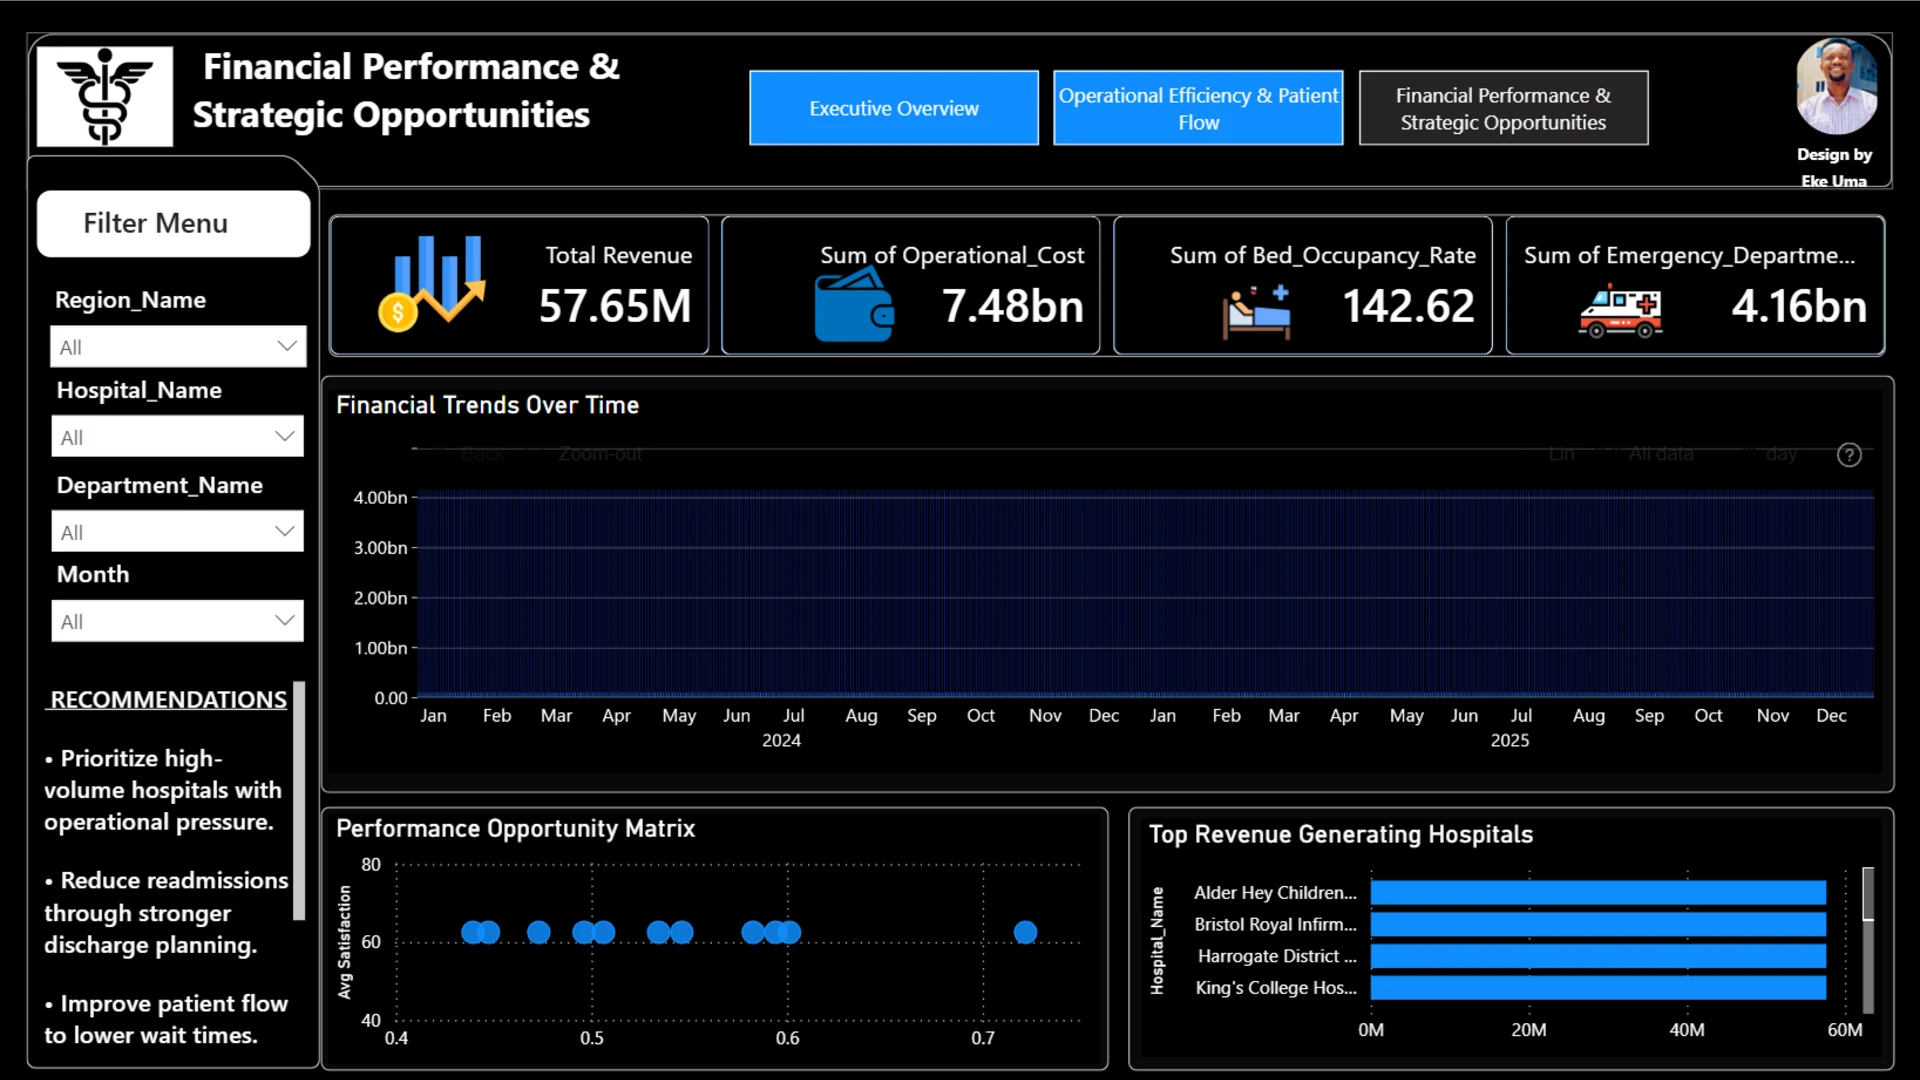
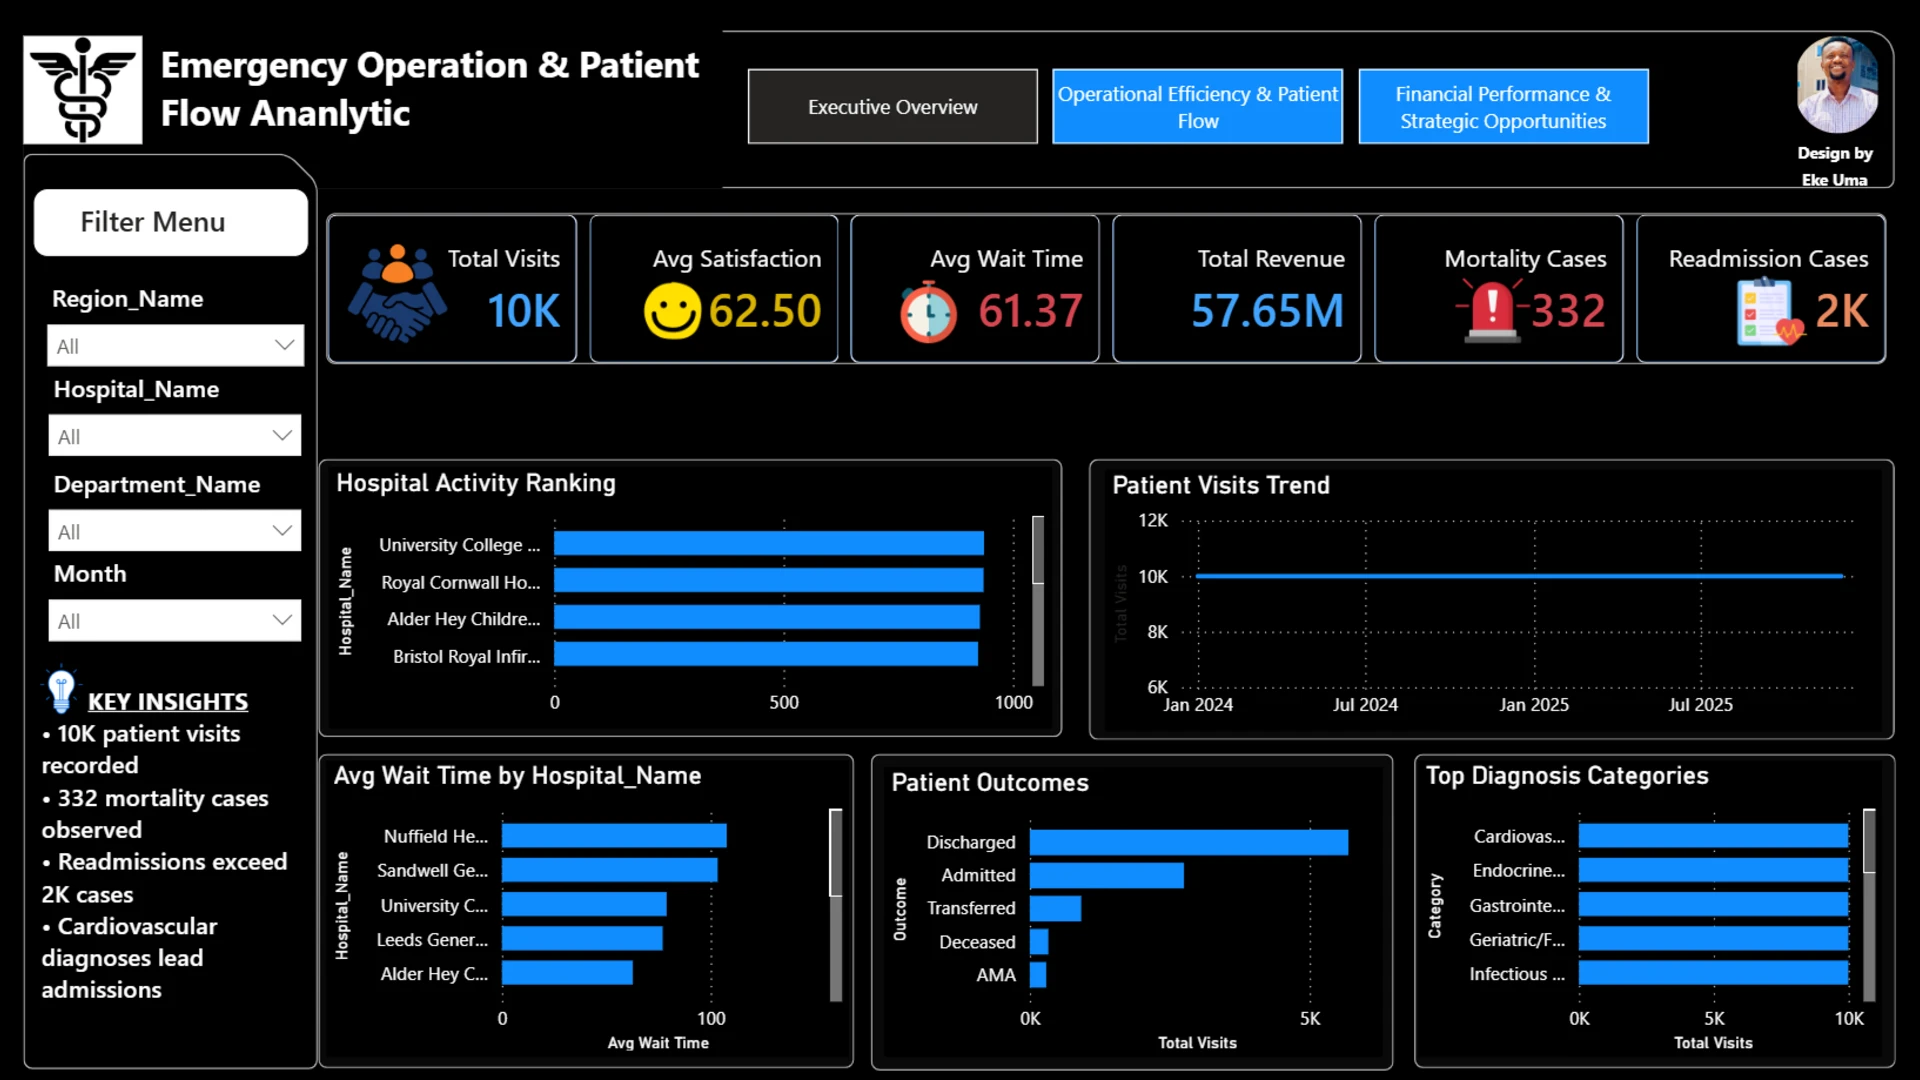
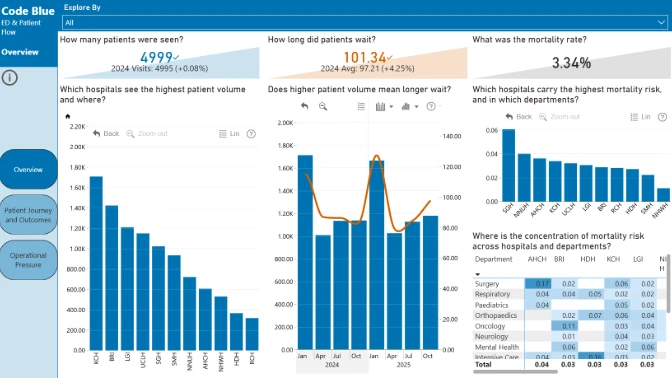
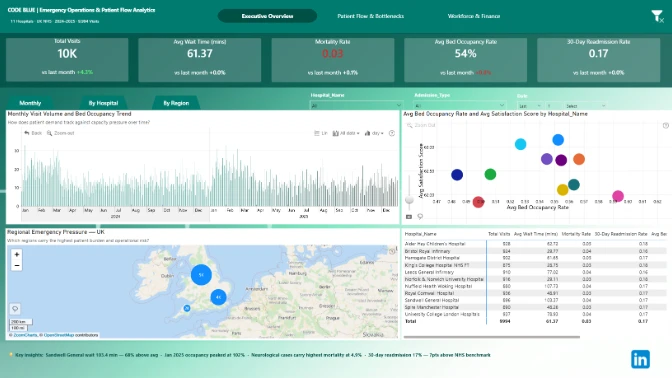
This interactive Power BI report explores the Code Blue Emergency Operations & Patient Flow dataset. It analyzes hospital performance, patient flow, bed capacity, emergency operations, pressure points, risks, inefficiencies, and outcome factors across hospitals and key healthcare segments.
Submitted to the FP20 Analytics ZoomCharts Data Challenge 38: Emergency Operations & Patient Flow Analytics, using native Power BI visuals and ZoomCharts Drill Down PRO custom visuals.
Author’s Description:
This Power BI dashboard analyzes emergency department operations, patient flow, and financial performance across multiple hospitals and regions. It helps healthcare leaders identify operational bottlenecks, monitor patient outcomes, and compare performance across hospitals, departments, and time periods using interactive ZoomCharts drill-down visuals. The analysis highlights variations in patient demand, waiting times, readmissions, and operational efficiency, revealing opportunities to improve resource allocation and service delivery. Built with Power BI, Power Query, DAX, and ZoomCharts custom visuals, the report supports informed, data-driven decision-making at both executive and operational levels.



4U Report Challenges
Participate in data challenges, build and submit reports to get free template downloads.
Join CommunityMobile view allows you to interact with the report. To Download the template please switch to desktop view.
How to use a PBIX template
Preview the interactive report, download the PBIX file, open it in Power BI Desktop, and replace the same data connection with your own dataset.
Preview and download
Explore the report online and download the PBIX template file.
Open in Power BI Desktop
Open the downloaded PBIX file in Power BI Desktop.
Connect your data
Replace the sample data source with your own dataset.
Refresh and adjust
Refresh the model and update fields or visual were needed.
Save and share
Save your report and publish it for your audience.


