672
FP20_Candy_Project
FP20_Candy_Project
More Report pages
Report Author: Benjamin Kettey-Tagoe
672
Share template with others
Report submitted for the FP20 Analytics ZoomCharts Challenge, November 2024. The report was built using the Candy Market Share dataset and includes ZoomCharts custom Drill Down PRO visuals for Power BI.
Author's description:
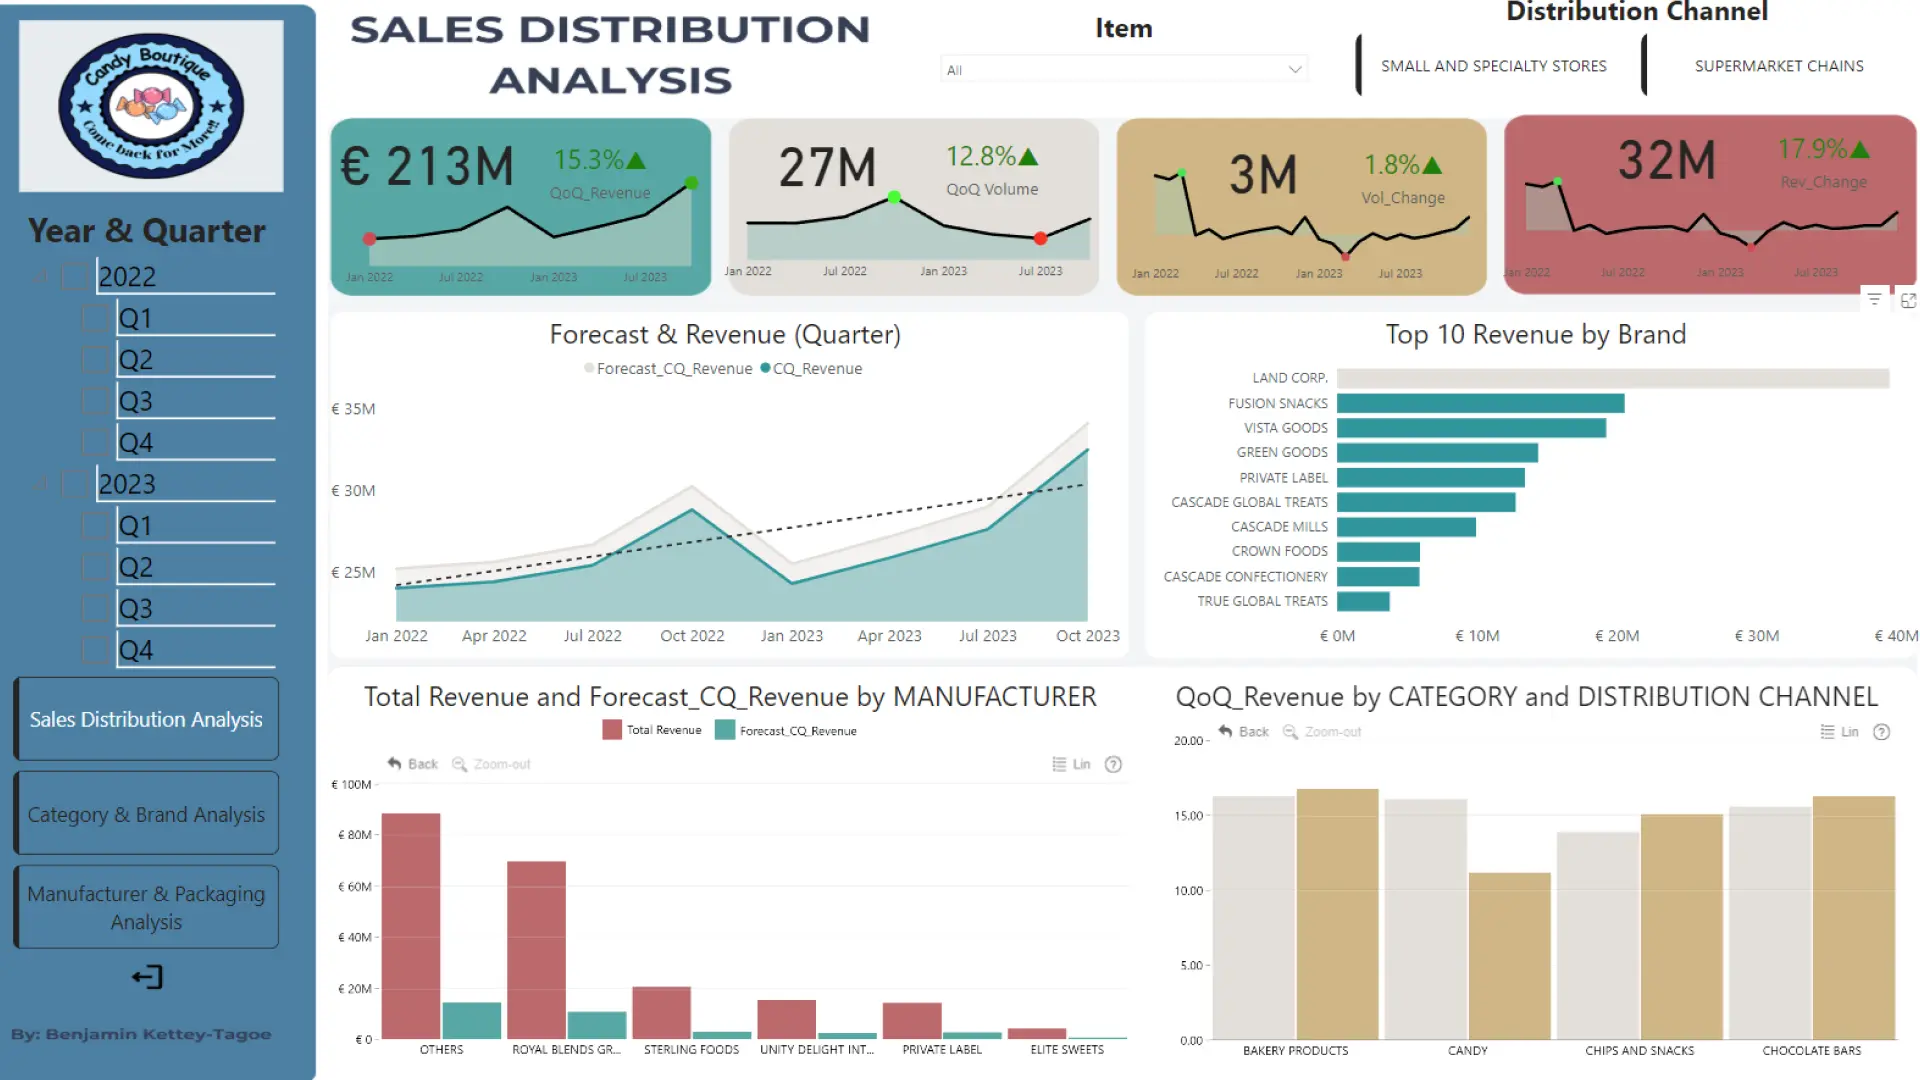
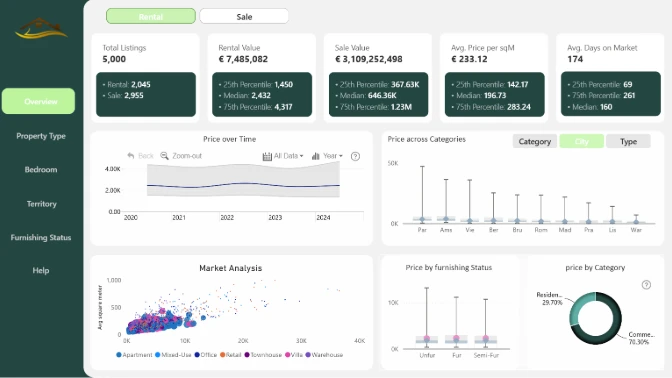
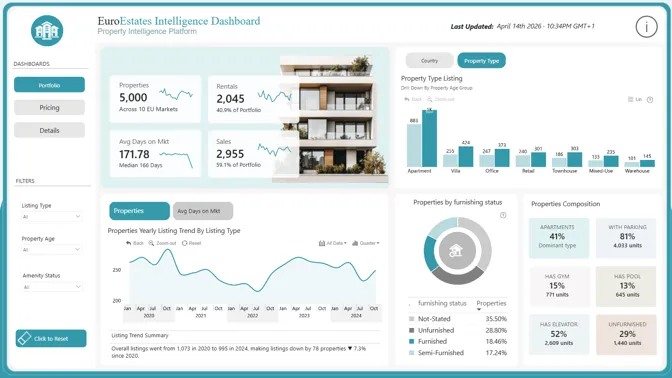
Sales Distribution Analysis – Examines trends over time, with items and distribution channels as slicers.
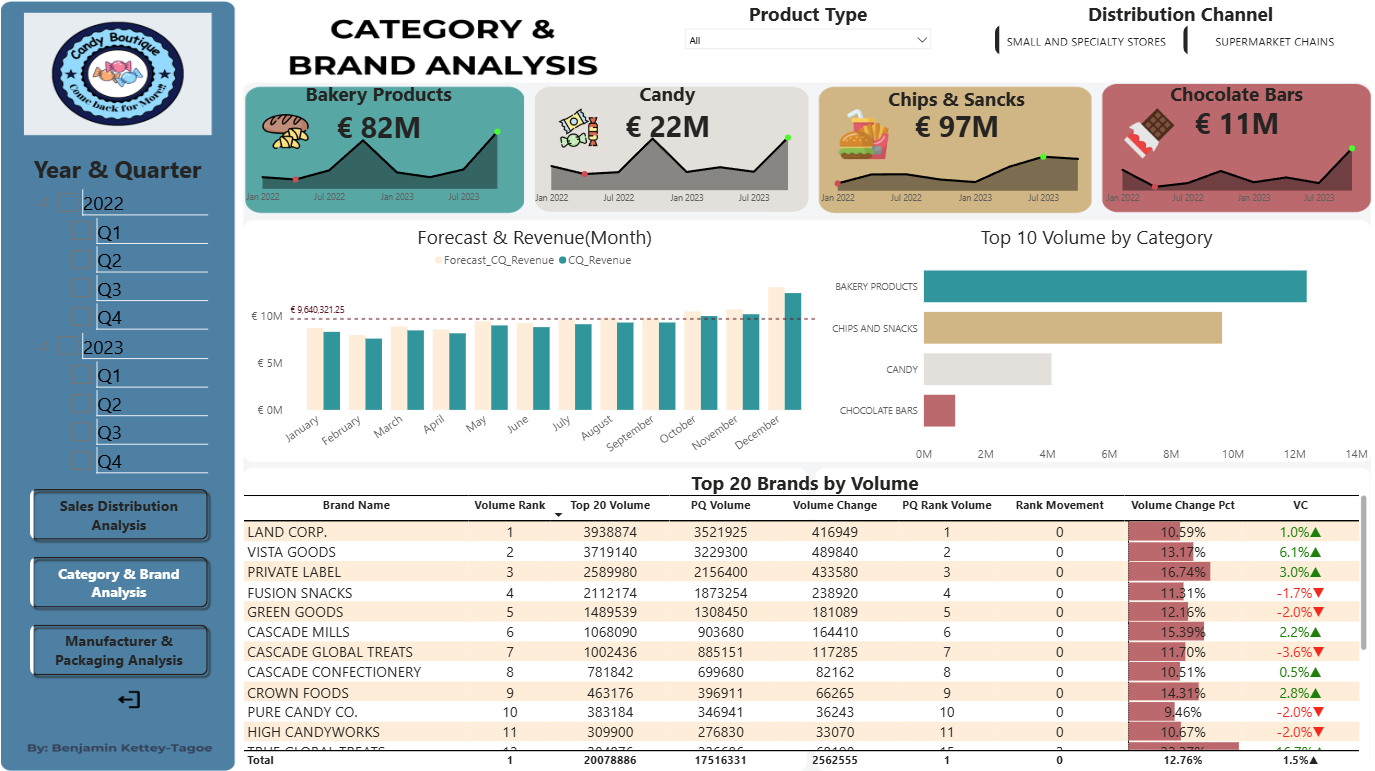
Category and Brand Analysis – Evaluates the popularity and performance of category types and brands, considering volumes and revenue based on movements made during the quarters.
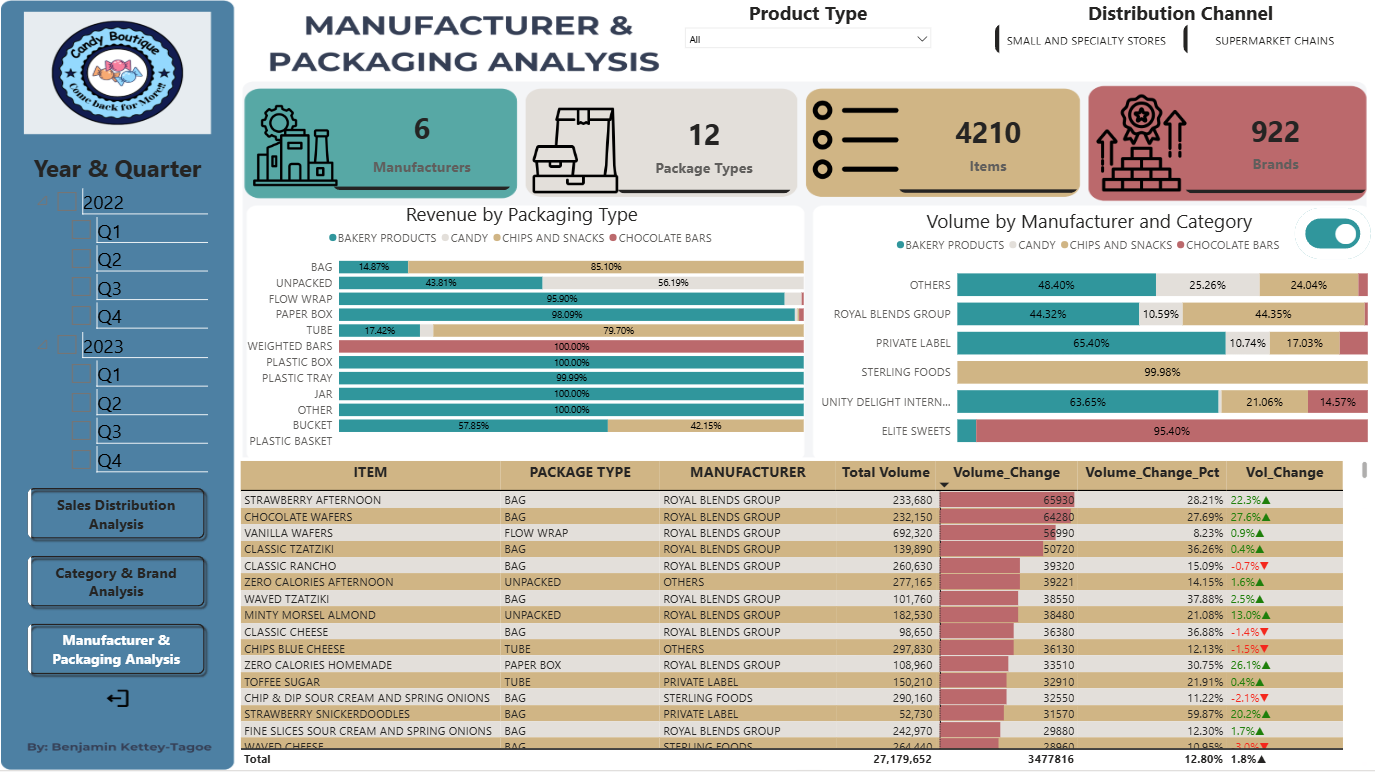
Manufacturer and Packaging Analysis – Identifies key manufacturers and packaging preferences that influence sales.
ZoomCharts visuals used
4U Report Challenges
Participate in data challenges, build and submit reports to get free template downloads.
Join CommunityMobile view allows you to interact with the report. To Download the template please switch to desktop view.
Was this helpful? Thank you for your feedback!
Sorry about that.
How can we improve it?