1024
FP20 Analytics Challenge 13: EDUCATION MANAGEMENT DASHBOARD
FP20 Analytics Challenge 13: EDUCATION MANAGEMENT DASHBOARD
More Report pages
Report Author: Moronkola Roseline
1024
Share template with others
Report submitted for FP20 Analytics ZoomCharts Challenge 13 (Jan 17 – Feb 15, 2024). The report was built with Education Management dataset and includes ZoomCharts custom Drill Down PRO visuals for Power BI.
Author's description:
INSIGHTS
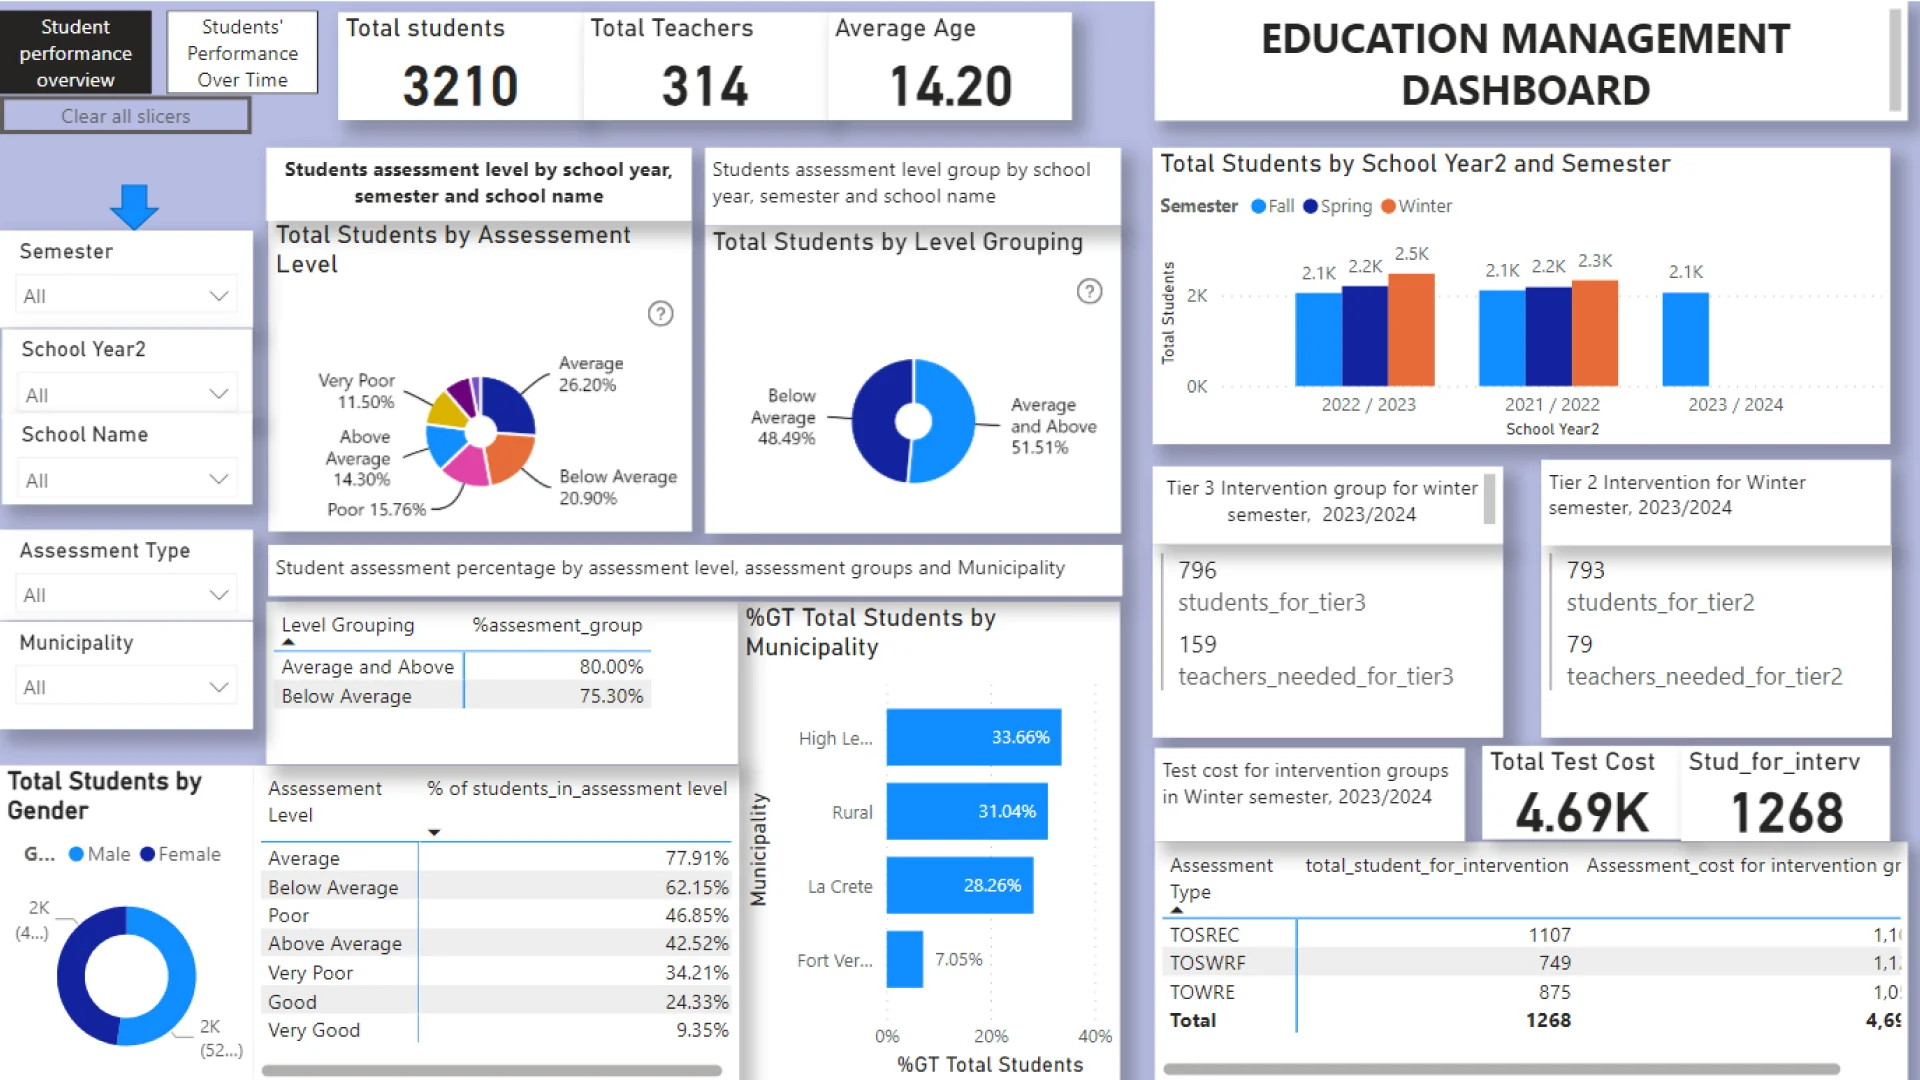
Students' gender: There are 52% male and 48% female
Assessment level: 3.14% were very good, 8.18% were good, 14.30% were above average while others were either below average, poor, or very poor. However, students with assessment levels of average and below (below average, poor, very poor) are considered to have poor results and will fall into the intervention groups tier 2 or tier3
Intervention groups:
tier 3 intervention group has 796 students and 159 teachers, with 5 students per teacher
tier 2 intervention group has 793 students and 59 teachers, with 10 students per teacher
The Intervention group classes start in the winter semester of the 2023/2024 school year and the students involved are determined based on student's performance in the fall semester of the 2022/2023 school year
The cost of organizing intervention groups for students is $4.69k
Comparing semesters among the school years:
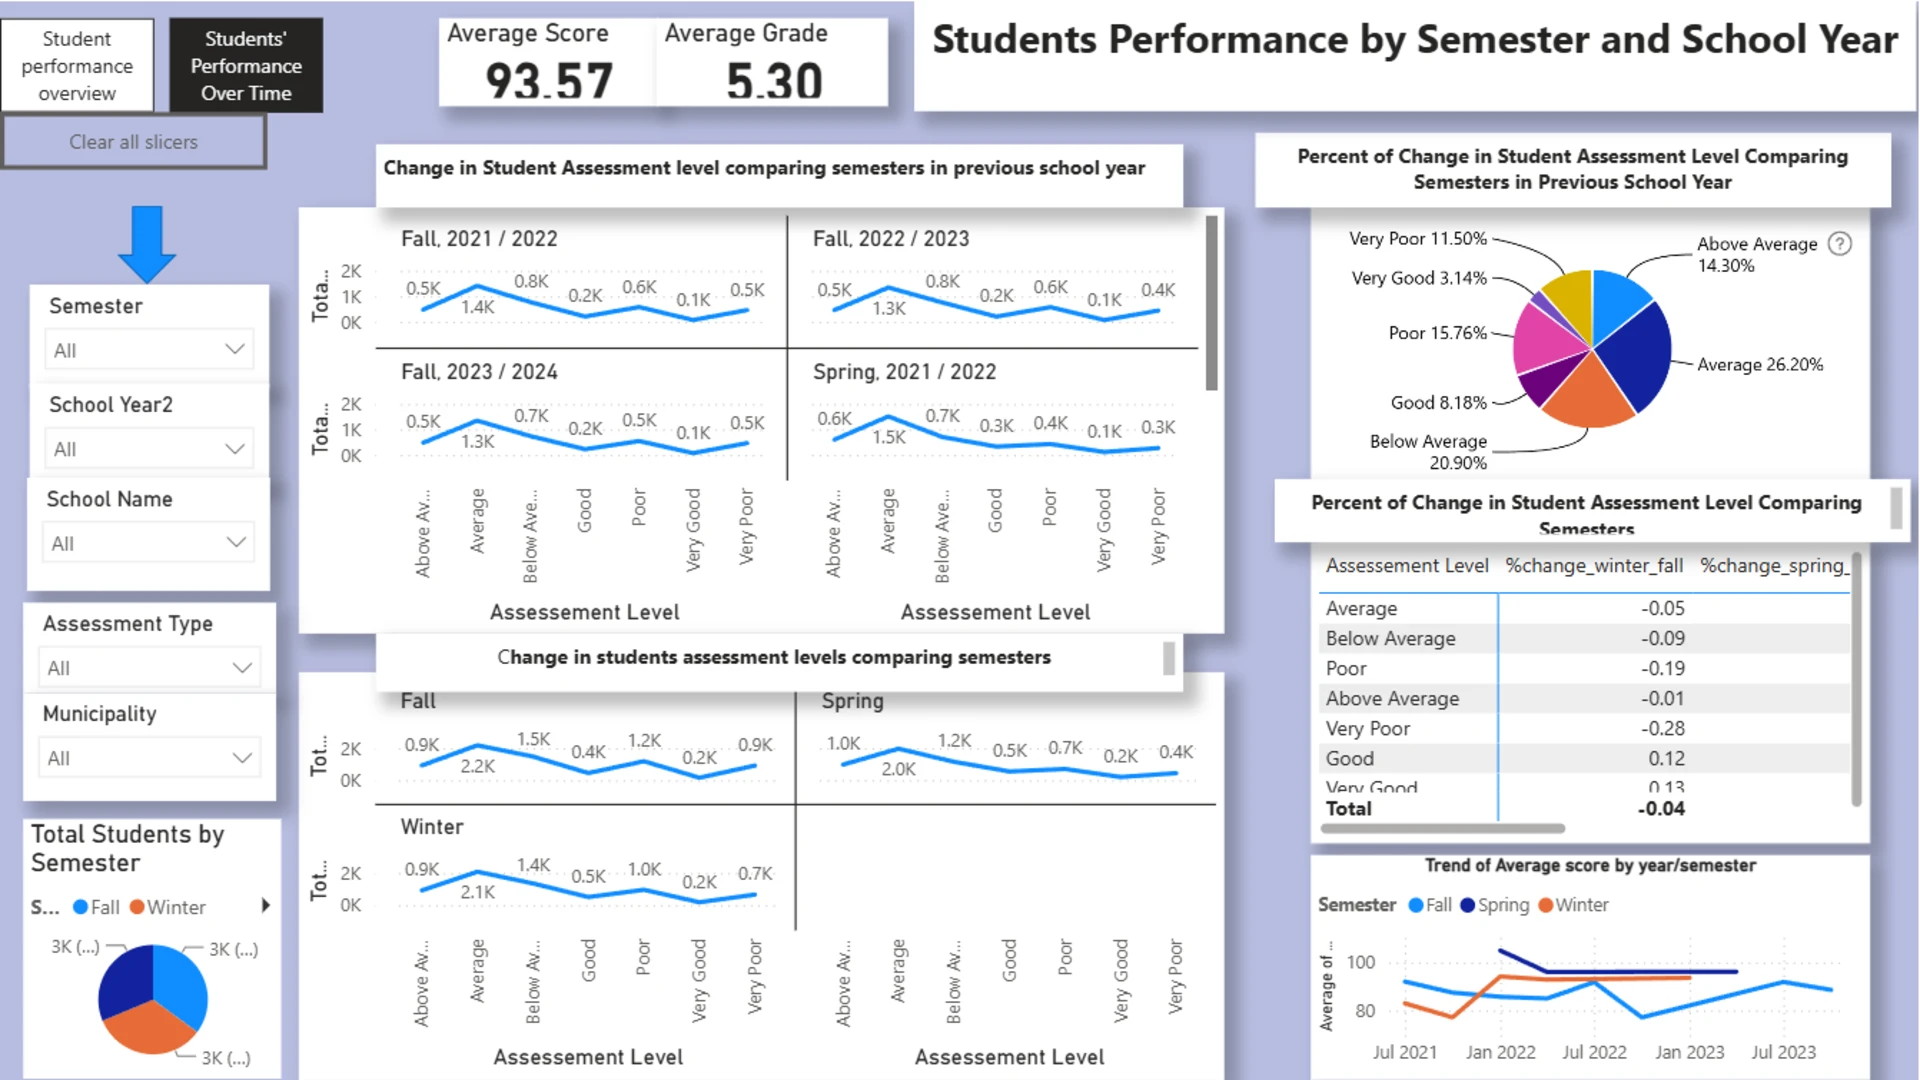
fall 2021/2022 There is a general decrease in student performance across all assessment level
fall 2022/2023 There is an increase in students with below-average and poor assessment levels indicating poor performance in other assessment levels
spring_2021/2022-2022/2023 There is a positive increase in student performance, however, there was a decrease in the number of students with average assessment level
winter 2021/2022-2022/2023There is a general increase in students performance across all assessment levels
change in students' assessment level comparing semesters:
students tend to perform better in winter and spring than in fall
Average standard score: 93.5
Average grade during assessment:5
Students' average age:14 years


4U Report Challenges
Participate in data challenges, build and submit reports to get free template downloads.
Join CommunityMobile view allows you to interact with the report. To Download the template please switch to desktop view.
How to use a PBIX template
Preview the interactive report, download the PBIX file, open it in Power BI Desktop, and replace the same data connection with your own dataset.
Preview and download
Explore the report online and download the PBIX template file.
Open in Power BI Desktop
Open the downloaded PBIX file in Power BI Desktop.
Connect your data
Replace the sample data source with your own dataset.
Refresh and adjust
Refresh the model and update fields or visual were needed.
Save and share
Save your report and publish it for your audience.


