613
Enterprise Sales Pipeline Analytics
Enterprise Sales Pipeline Analytics
Report Author: Emilia Łapczyńska
613
Share template with others
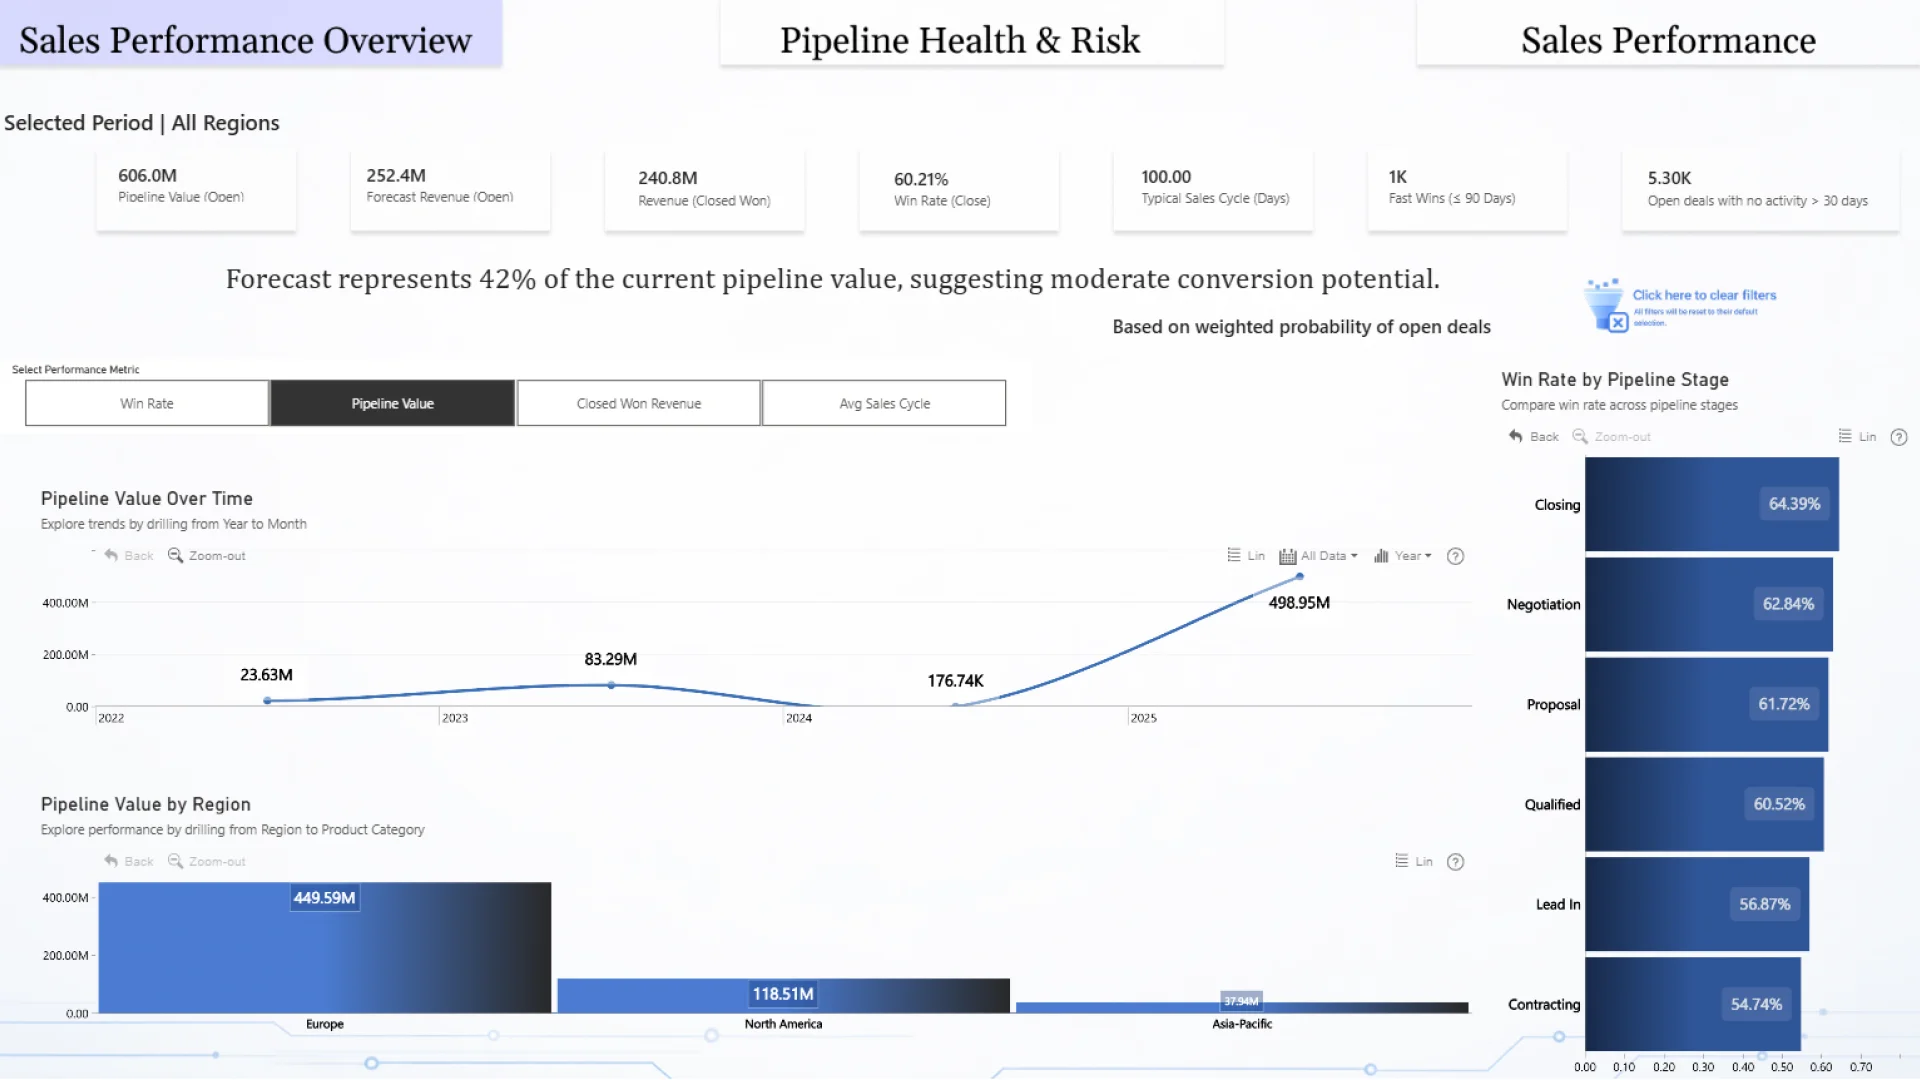
This interactive Power BI report explores the Global B2B Sales Pipeline & Deals Analytics dataset using ZoomCharts Drill Down PRO custom visuals for Power BI. It highlights pipeline value, deal progression, sales activity, and client engagement across regions and industries, helping teams monitor pipeline health and identify stalled or high-risk deals.
The report was submitted to the FP20 Analytics ZoomCharts Data Challenge #35 (February – March 2026).
Author’s Description:
This report analyzes the performance and health of an enterprise sales pipeline using ZoomCharts visuals in Power BI. The dashboard focuses on three key analytical areas:
-
Sales performance and revenue trends
-
Conversion effectiveness across pipeline stages
-
Pipeline risk related to deal aging and inactivity
Interactive visuals enable users to explore revenue drivers, deal progression, and potential bottlenecks in the sales process. The goal of this report is to support sales leaders in identifying growth opportunities and potential pipeline risks.
ZoomCharts visuals used
4U Report Challenges
Participate in data challenges, build and submit reports to get free template downloads.
Join CommunityMobile view allows you to interact with the report. To Download the template please switch to desktop view.
Was this helpful? Thank you for your feedback!
Sorry about that.
How can we improve it?