1401
EMPLOYEE PERFORMANCE AND PRODUCTIVITY (UPDATED VERSION)
EMPLOYEE PERFORMANCE AND PRODUCTIVITY (UPDATED VERSION)
More Report pages
Report Author: Agbata Dickson Ukolojo
1401
Share template with others
Report submitted for Onyx Data DataDNA ZoomCharts Mini Challenge, October 2024. The report was built based on Employee Performance dataset and includes ZoomCharts custom Drill Down PRO visuals for Power BI.
Author's description:
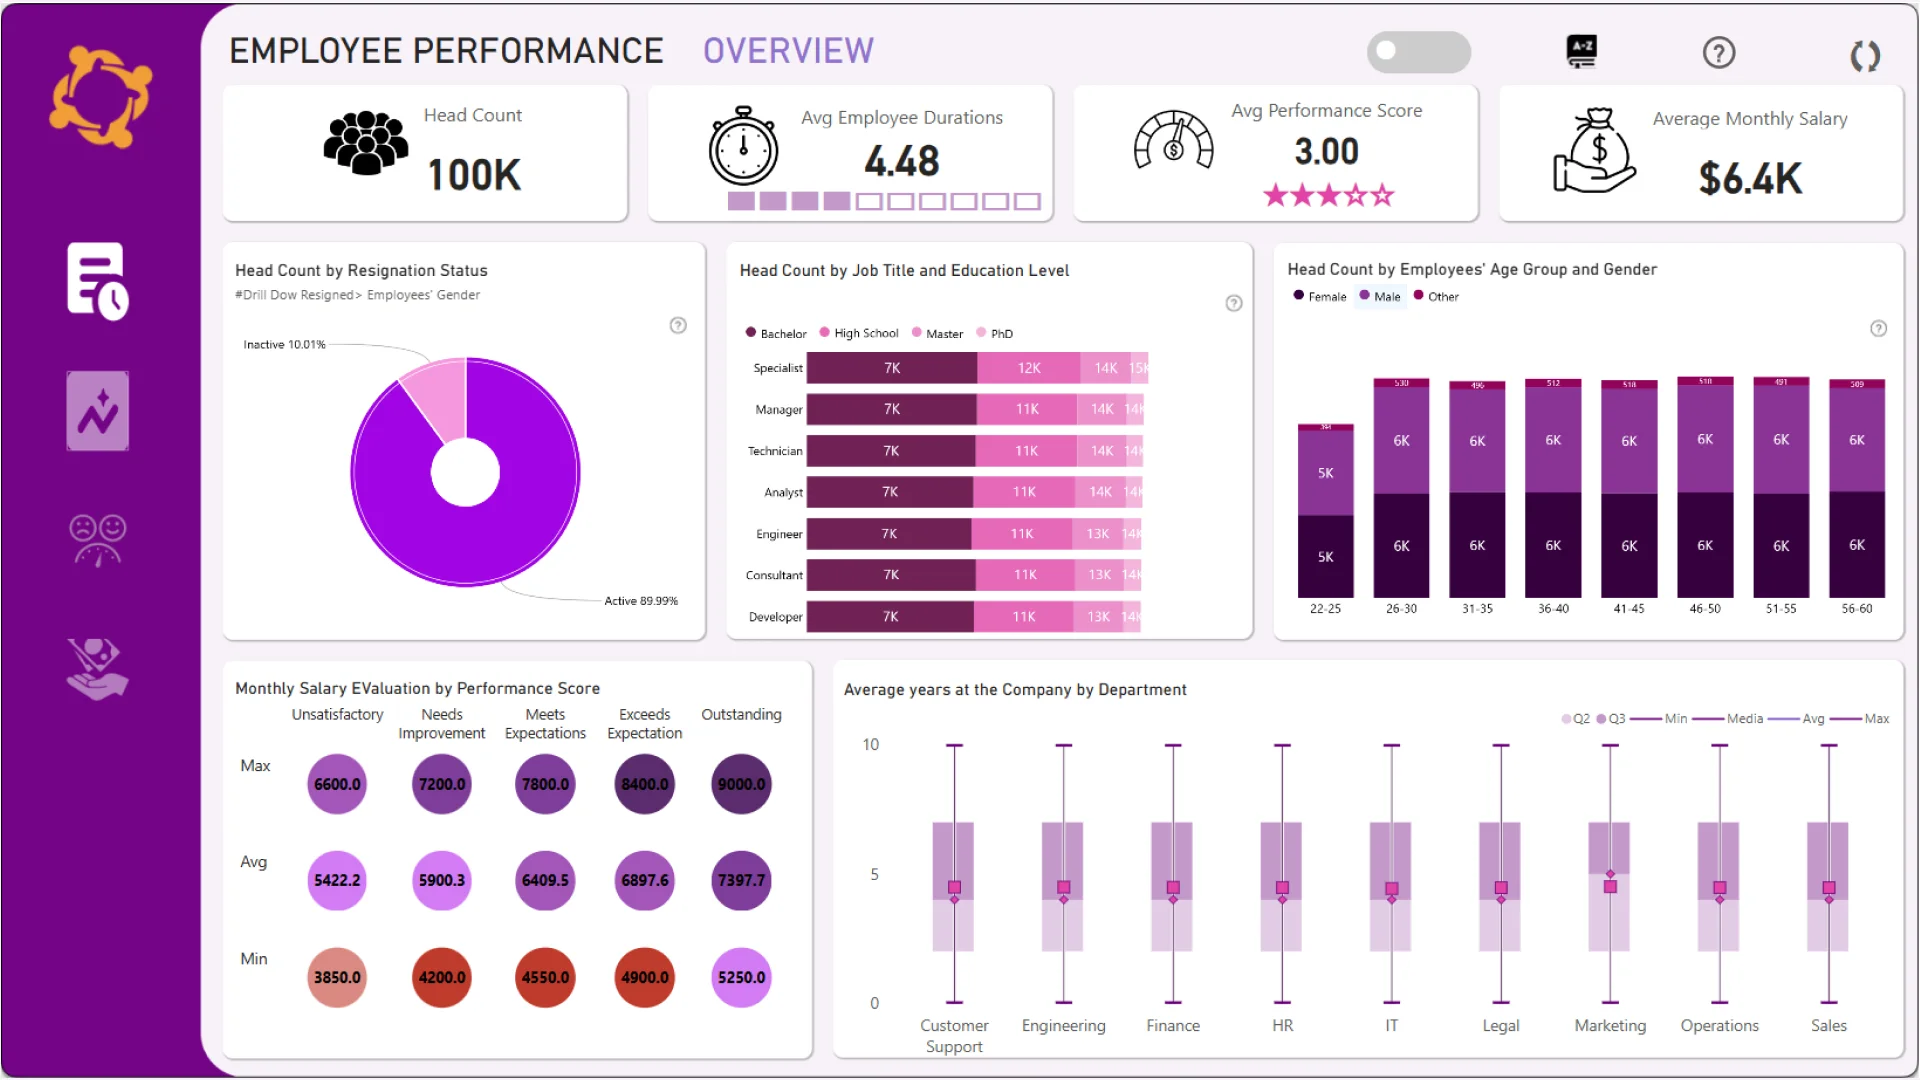
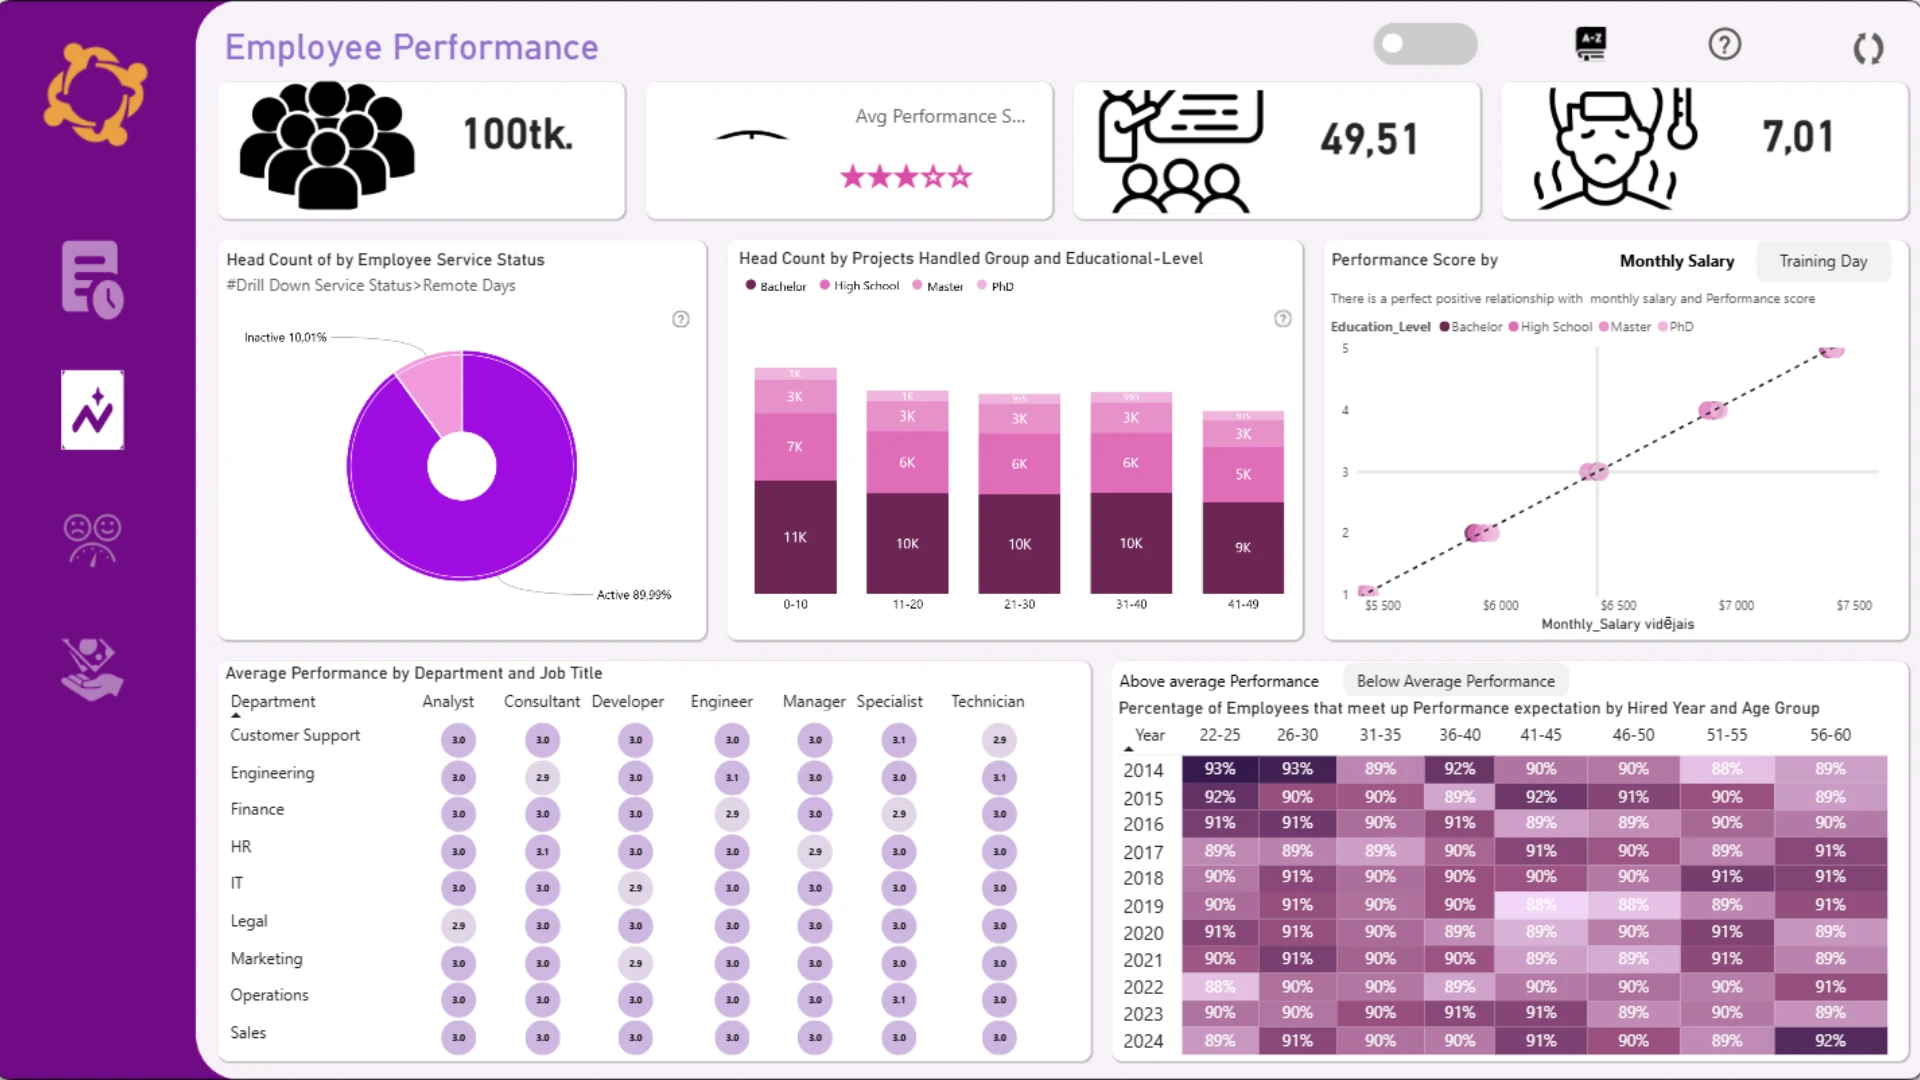
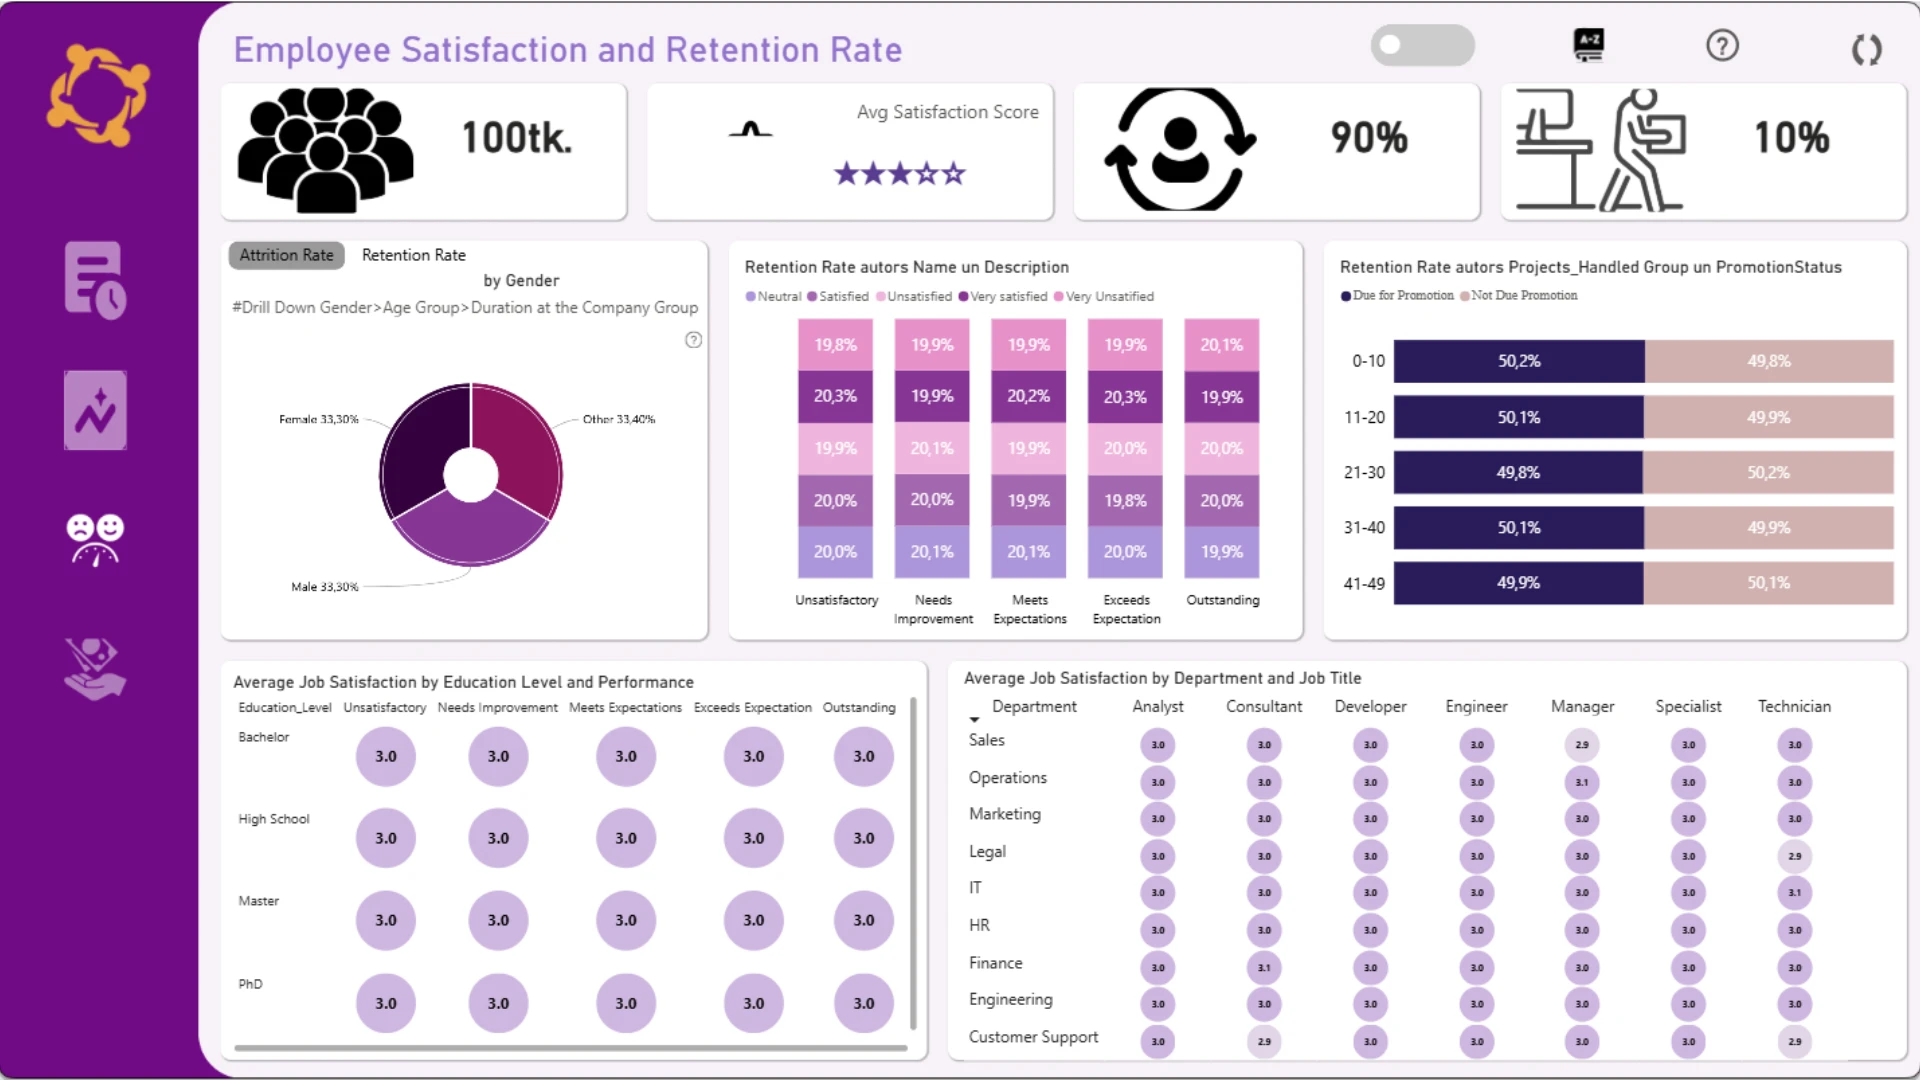
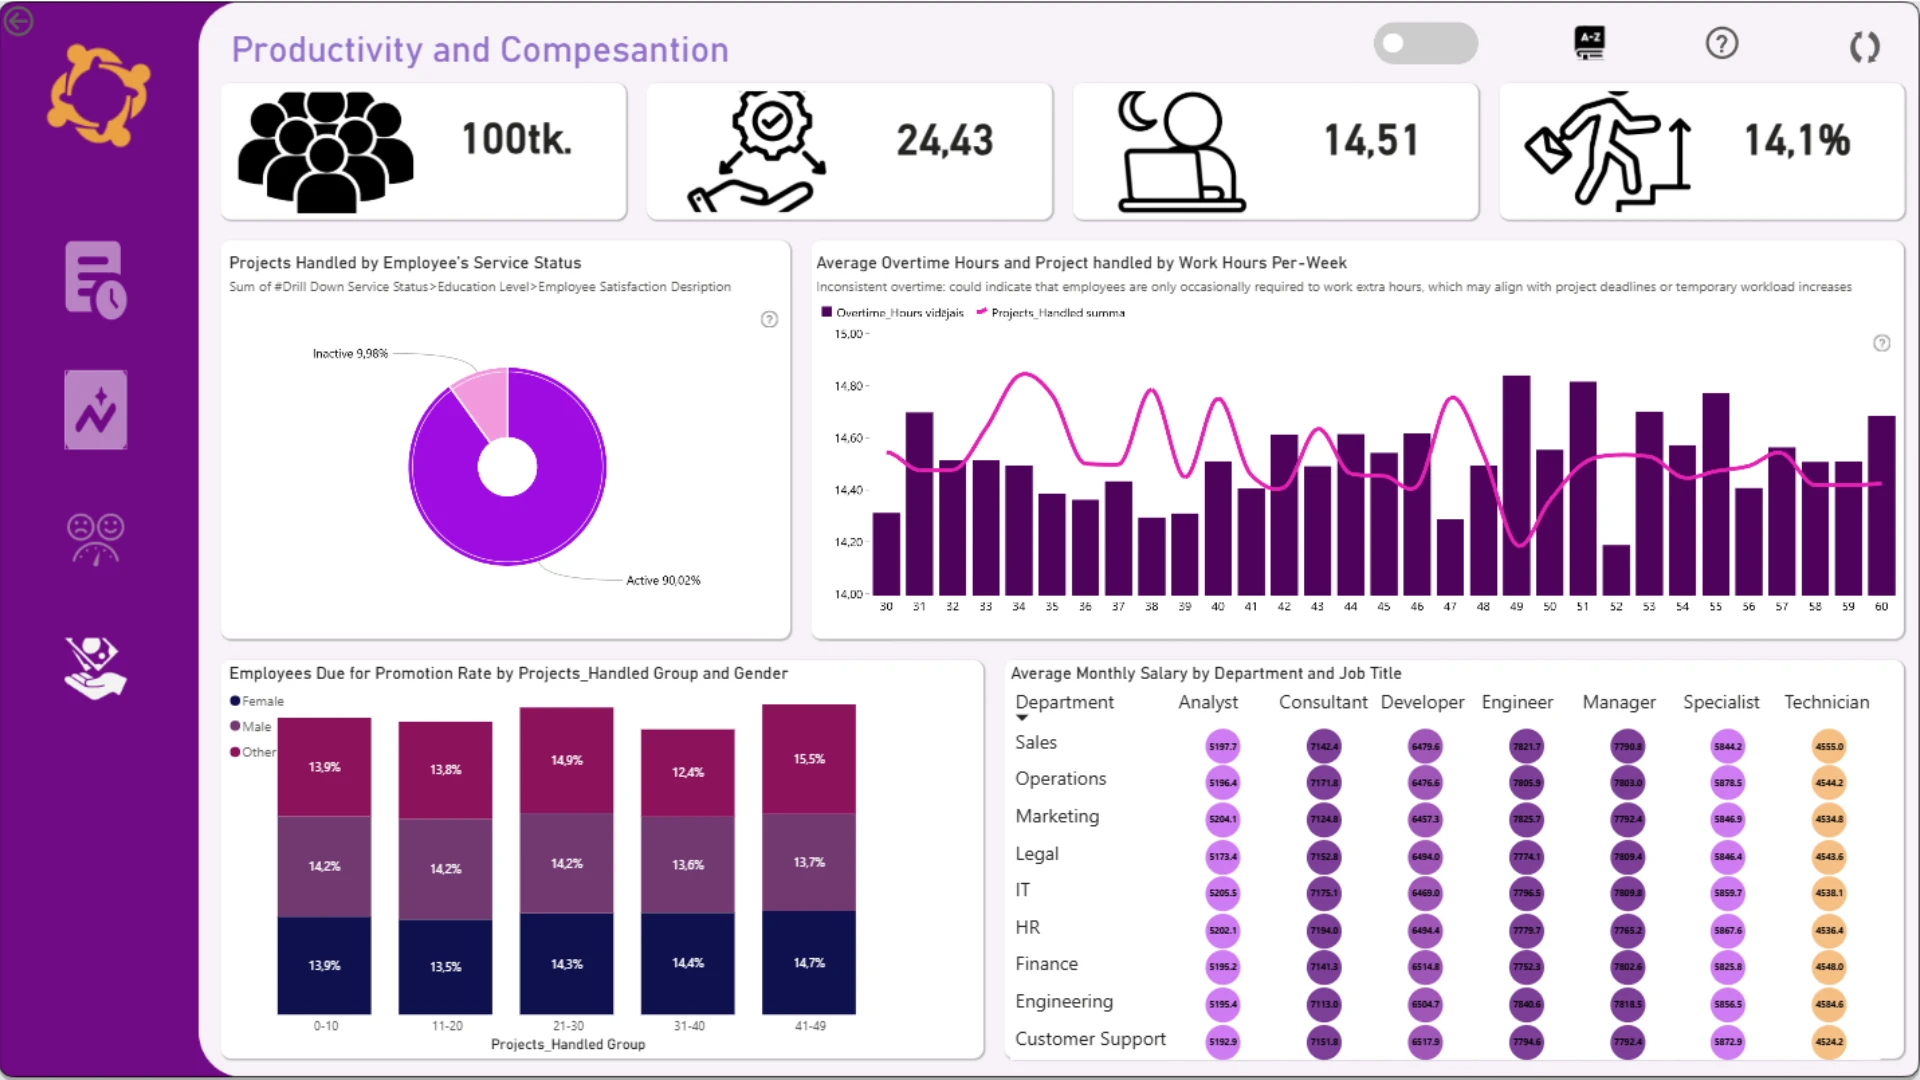
DESCRIPTION The report is divided into four sections: Overview, Performance, Satisfaction & Retention Rate, and Productivity & Compensation. 1. Overview: This section includes the total Headcount by employee services status, gender, job title, Age group distribution, Monthly Salary evaluation on performance, and employee duration distribution based on the department. 2. Performance: This section features the number of projects handled by education level, the relationship between performance and monthly salary, and sick days. It also compares performance between job titles in the department and provides statistics on an employee who performed above average during the hired year. 3. Satisfaction & Retention Rate: This section presents the attrition and retention rate of gender, Performance title, projects handled group, and employee work satisfaction by education level, department, and job title. 4. Productivity & Compensation: This section includes projects handled by gender, work Hours per week, and overtime hours. Projects handled group and statistics of employees who are due for promotion, as well as monthly salary of job title in a department.



4U Report Challenges
Participate in data challenges, build and submit reports to get free template downloads.
Join CommunityMobile view allows you to interact with the report. To Download the template please switch to desktop view.
How to use a PBIX template
Preview the interactive report, download the PBIX file, open it in Power BI Desktop, and replace the same data connection with your own dataset.
Preview and download
Explore the report online and download the PBIX template file.
Open in Power BI Desktop
Open the downloaded PBIX file in Power BI Desktop.
Connect your data
Replace the sample data source with your own dataset.
Refresh and adjust
Refresh the model and update fields or visual were needed.
Save and share
Save your report and publish it for your audience.


