1060
Employee performance Analytics Dashboard
Employee performance Analytics Dashboard
More Report pages
Report Author: Arinze Johnpaul
1060
Share template with others
Report submitted for Onyx Data DataDNA ZoomCharts Mini Challenge, October 2024. The report was built based on Employee Performance dataset and includes ZoomCharts custom Drill Down PRO visuals for Power BI.
Author's description:
My comprehensive 5-page dashboard unlocks key trends, correlations, and actionable recommendations. Dashboard Overview
1. Cover Page: Welcome to the gateway of insights!
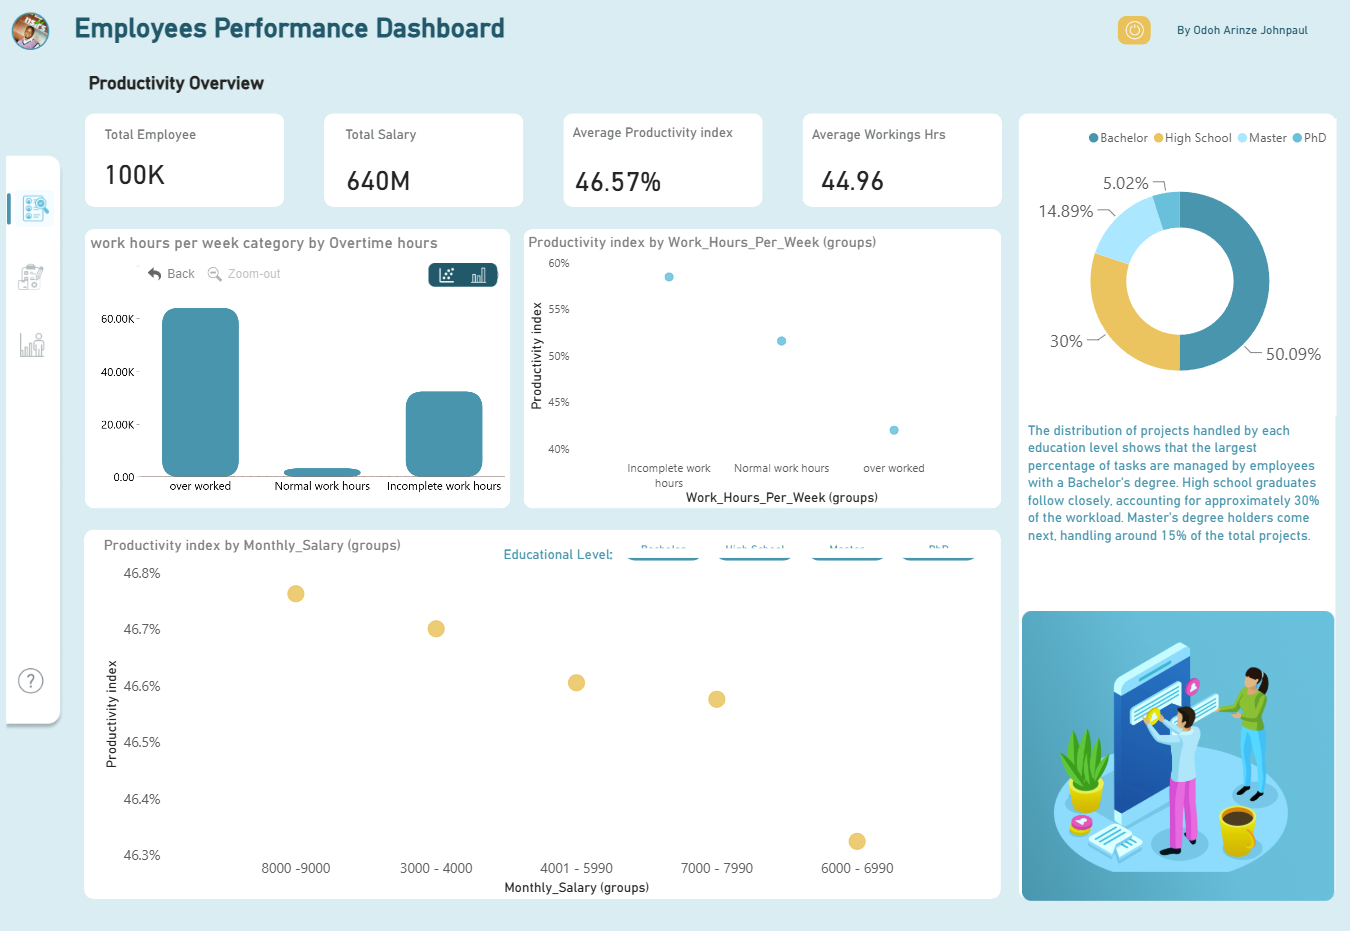
2. Productivity Insights: Uncover how work patterns, hours, overtime, and salary impact productivity.
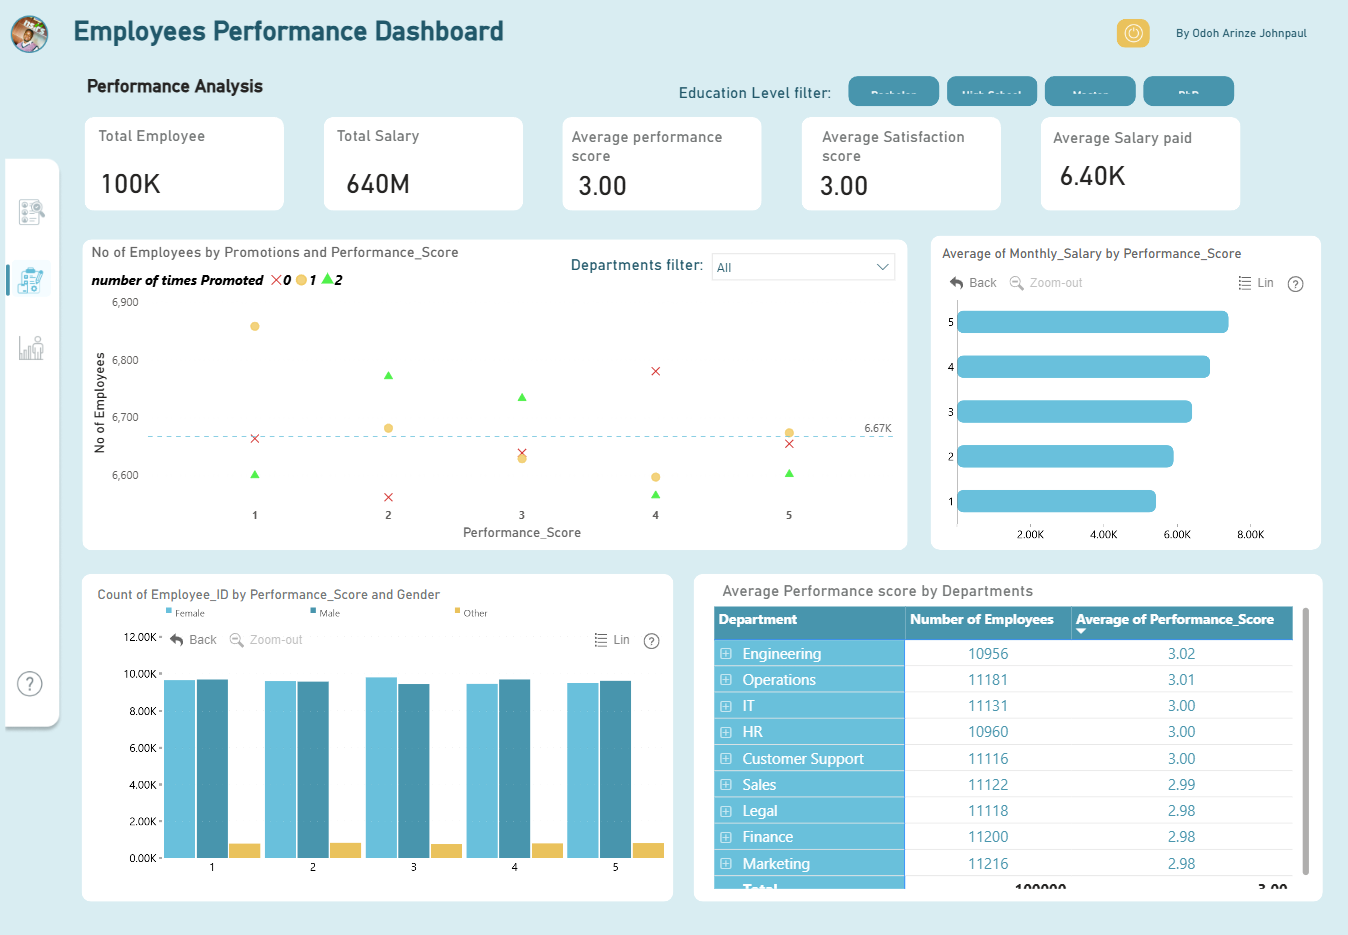
3. Performance Analysis: Explore performance score relationships with departmental satisfaction.
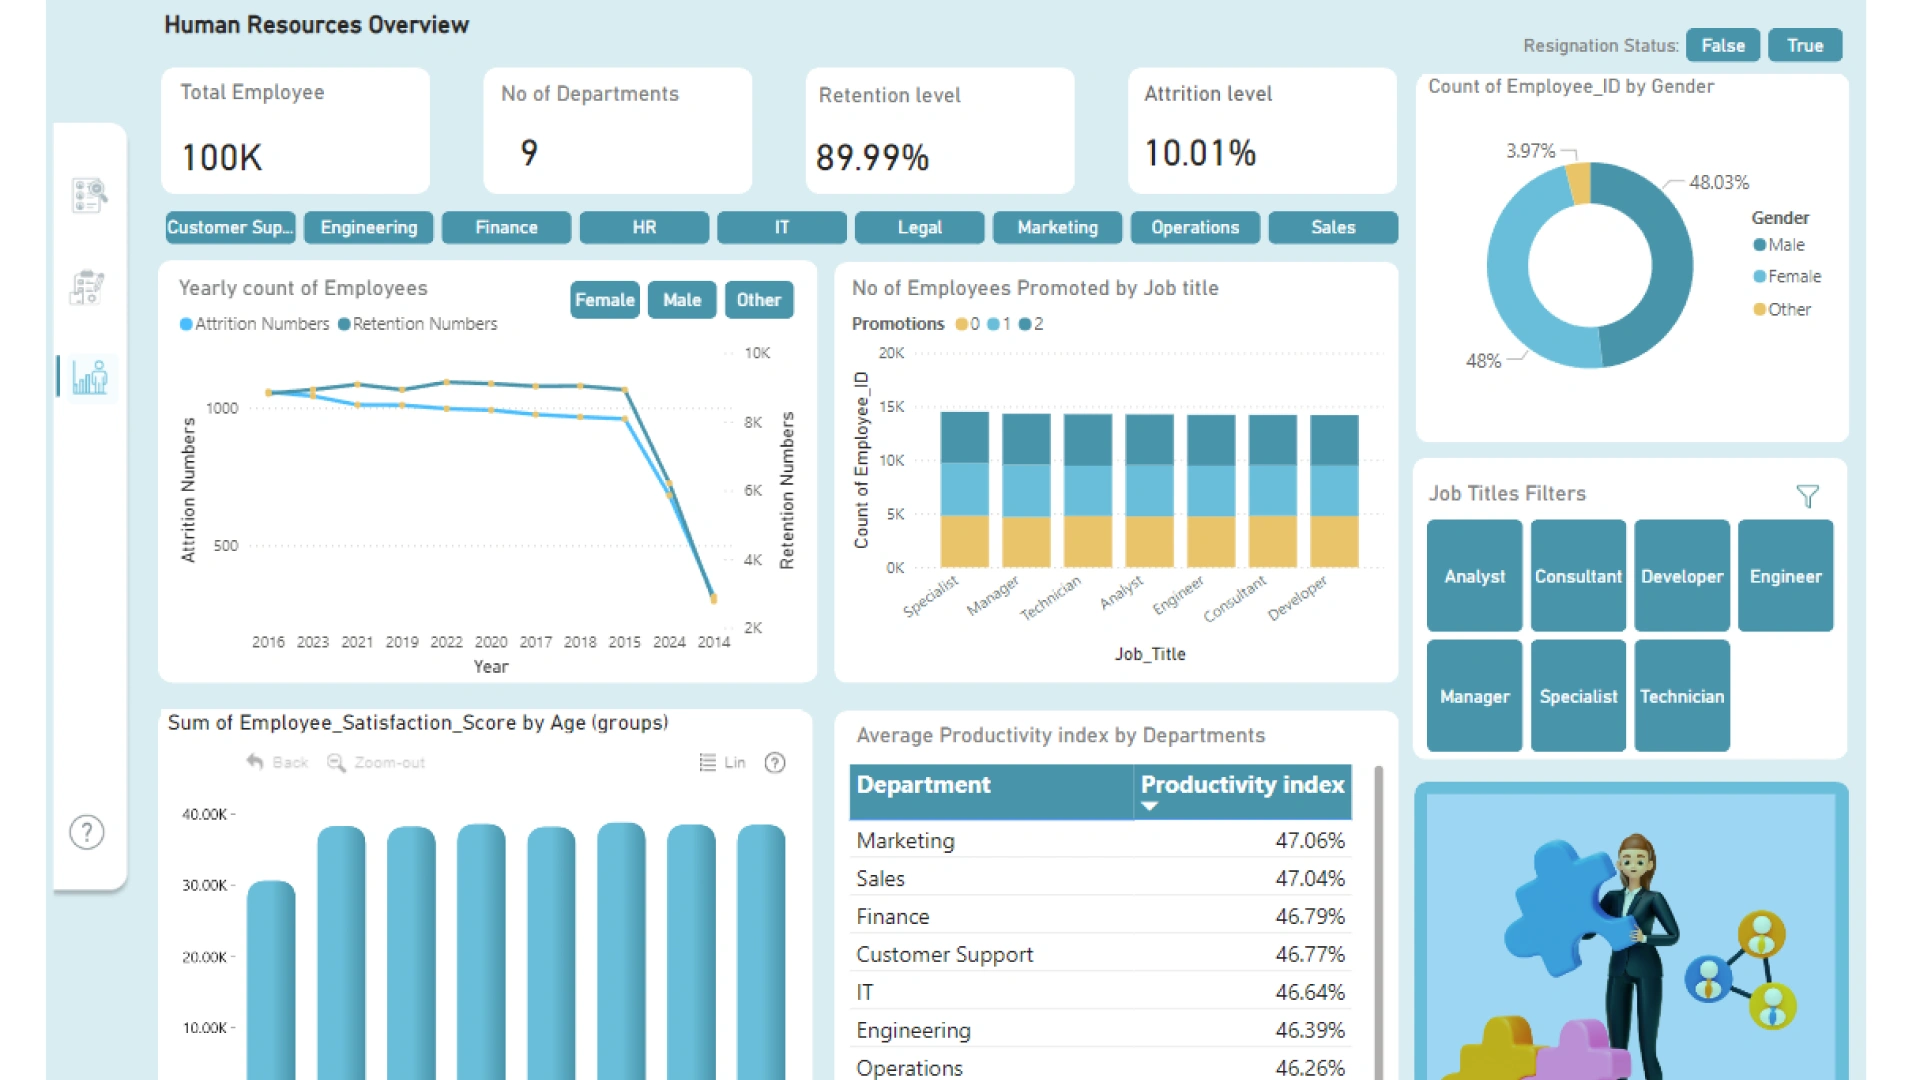
4. Human Resource Insights: Delve into demographic analysis, retention, and attrition rates.
5. Help Desk: Master dashboard navigation and uncover the productivity index formula.
4U Report Challenges
Participate in data challenges, build and submit reports to get free template downloads.
Join CommunityMobile view allows you to interact with the report. To Download the template please switch to desktop view.

Was this helpful? Thank you for your feedback!
Sorry about that.
How can we improve it?