1882
Employee Performance Analysis 3
Employee Performance Analysis 3
More Report pages
Report Author: Mahnoor Jahangir
1882
Share template with others
Report submitted for Onyx Data DataDNA ZoomCharts Mini Challenge, October 2024. The report was built based on Employee Performance dataset and includes ZoomCharts custom Drill Down PRO visuals for Power BI.
Author's description:
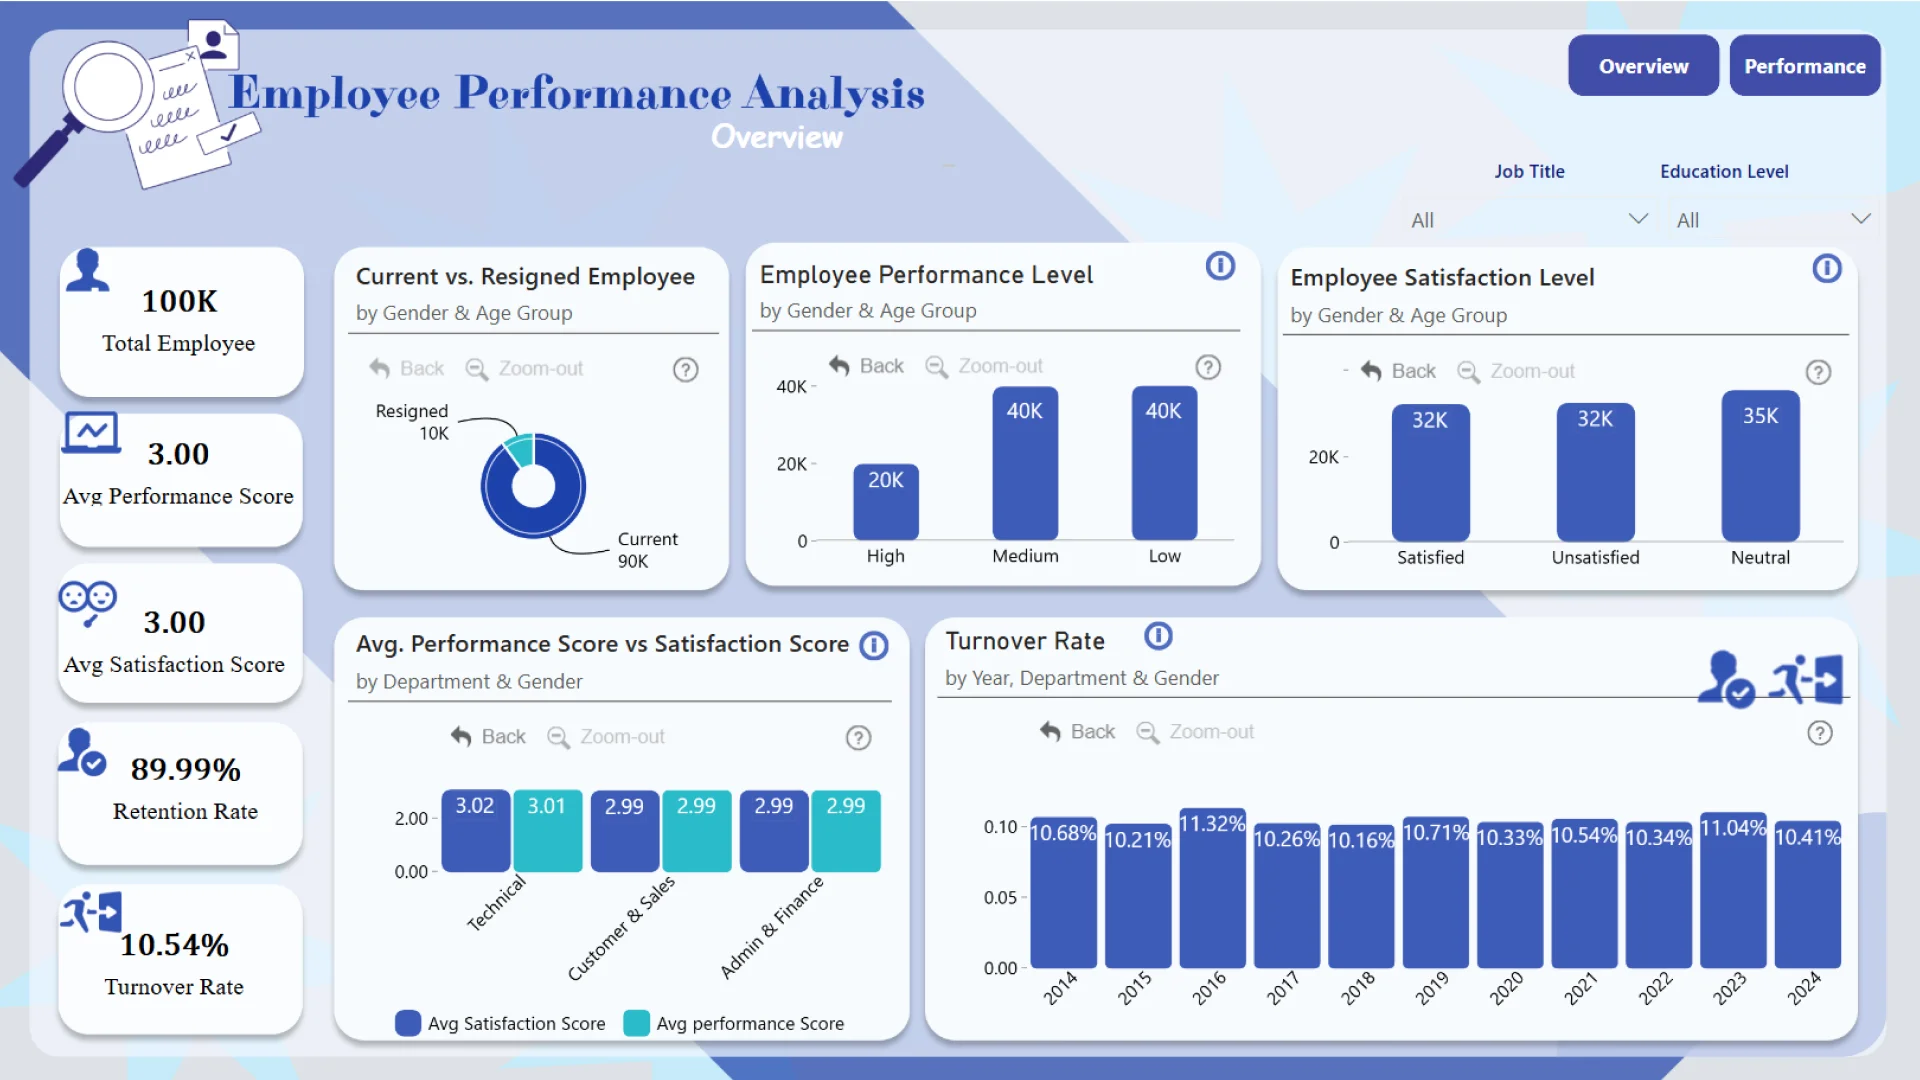
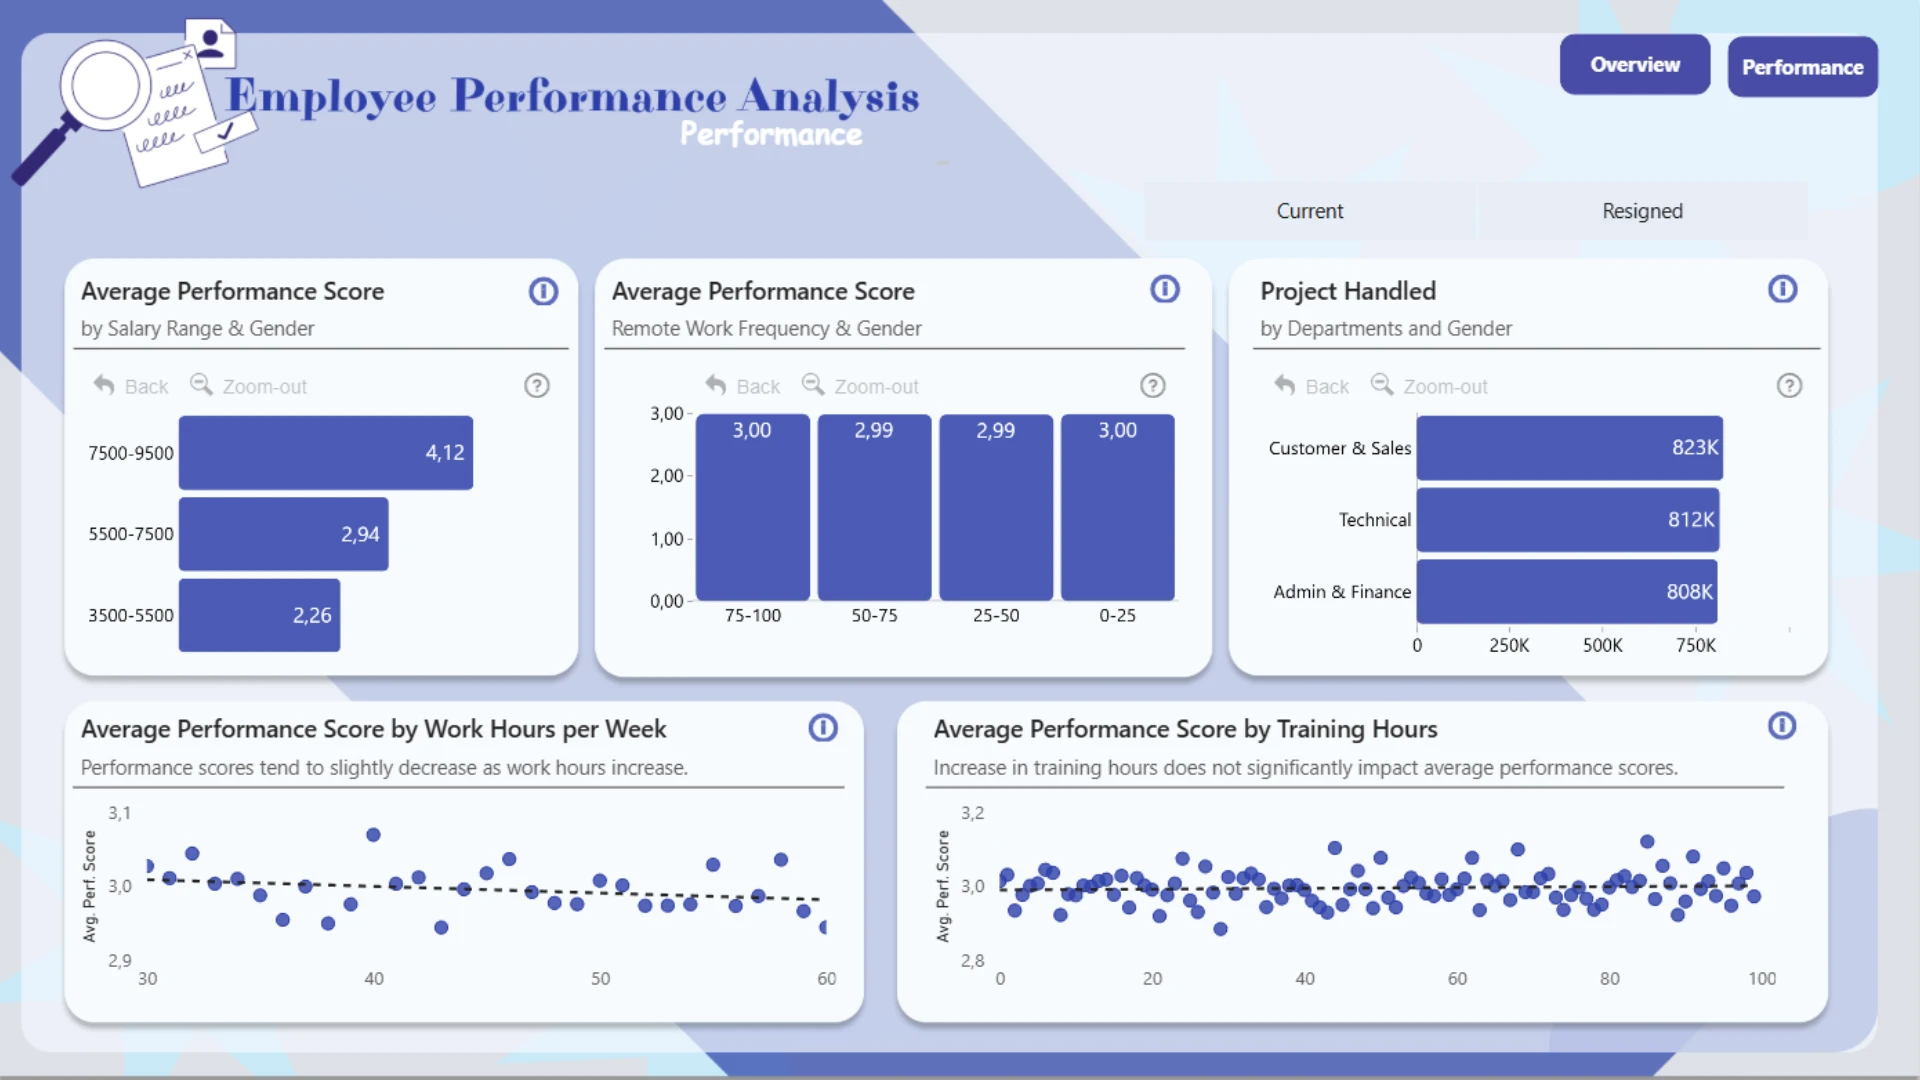
This Power BI dashboard provides an in-depth analysis of employee performance using various metrics like satisfaction levels, turnover rate, retention rate, and work hours. The dashboard is designed to offer actionable insights for HR teams, helping them understand the factors that influence performance and employee satisfaction. The report consists of three pages: Overview Page – Offers a high-level summary of key performance metrics. Performaance Page – Delves deeper into relationships between performance and factors like salary, training hours, and remote work frequency. Allows drill-down analysis by department, job title, and other demographic factors.
4U Report Challenges
Participate in data challenges, build and submit reports to get free template downloads.
Join CommunityMobile view allows you to interact with the report. To Download the template please switch to desktop view.

Was this helpful? Thank you for your feedback!
Sorry about that.
How can we improve it?