845
Employee Performace
Employee Performace
Report Author: Varun Singhal
845
Share template with others
Report submitted for Onyx Data DataDNA ZoomCharts Mini Challenge, October 2024. The report was built based on Employee Performance dataset and includes ZoomCharts custom Drill Down PRO visuals for Power BI.
Author's description:
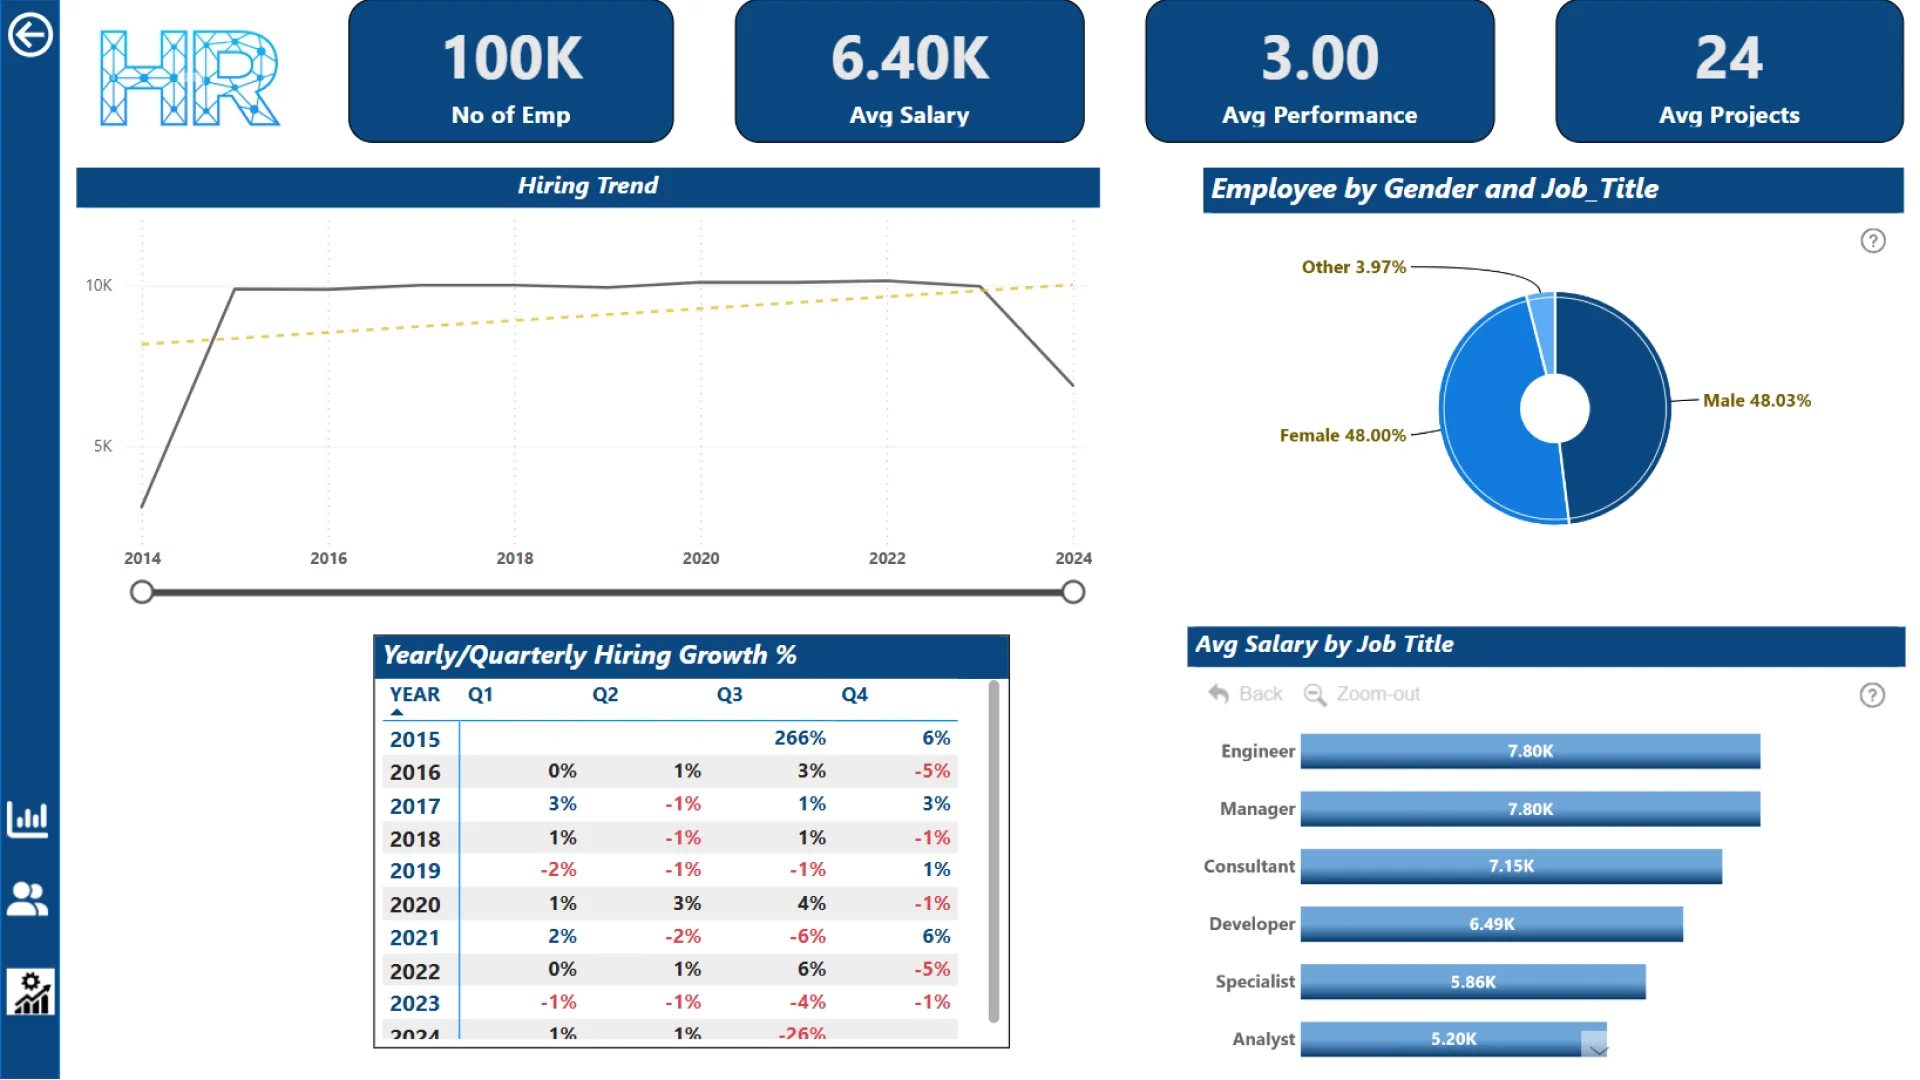
My report consists of three pages covering key metrics, a summary overview, and a detailed breakdown of hiring trends. Key elements include the year-over-year (YoY) growth in hiring percentage, which shows generally favorable trends apart from 2015 and 2021. Additionally, I highlighted workforce metrics such as employee demographics, performance levels, and departmental comparisons. My analysis explores patterns like the positive impact of work flexibility on performance and identifies how sick days increase with age and overtime hours, while promotion rates tend to decrease with age, even with steady tenure and project involvement.
ZoomCharts visuals used
4U Report Challenges
Participate in data challenges, build and submit reports to get free template downloads.
Join CommunityMobile view allows you to interact with the report. To Download the template please switch to desktop view.

Was this helpful? Thank you for your feedback!
Sorry about that.
How can we improve it?